Embedding-based News Recommendation
for Millions of Users
Shumpei Okura
Yahoo Japan Corporation
Tokyo, Japan
sokura@yahoo-corp.jp
Shingo Ono
Yahoo Japan Corporation
Tokyo, Japan
shiono@yahoo-corp.jp
Yukihiro Tagami
Yahoo Japan Corporation
Tokyo, Japan
yutagami@yahoo-corp.jp
Akira Tajima
Yahoo Japan Corporation
Tokyo, Japan
atajima@yahoo-corp.jp
ABSTRACT
It is necessary to understand the content of articles and user pref-
erences to make effective news recommendations. While ID-based
methods, such as collaborative filtering and low-rank factoriza-
tion, are well known for making recommendations, they are not
suitable for news recommendations because candidate articles ex-
pire quickly and are replaced with new ones within short spans of
time. Word-based methods, which are often used in information
retrieval settings, are good candidates in terms of system perfor-
mance but have issues such as their ability to cope with synonyms
and orthographical variants and define “queries” from users’ his-
torical activities. This paper proposes an embedding-based method
to use distributed representations in a three step end-to-end man-
ner: (i) start with distributed representations of articles based on
a variant of a denoising autoencoder, (ii) generate user represen-
tations by using a recurrent neural network (RNN) with browsing
histories as input sequences, and (iii) match and list articles for
users based on inner-product operations by taking system perfor-
mance into consideration.
The proposed method performed well in an experimental of-
fline evaluation using past access data on Yahoo! JAPAN’s home-
page. We implemented it on our actual news distribution sys-
tem based on these experimental results and compared its online
performance with a method that was conventionally incorporated
into the system. As a result, the click-through rate (CTR) improved
by 23% and the total duration improved by 10%, compared with the
conventionally incorporated method. Services that incorporated
the method we propose are already open to all users and provide
recommendations to over ten million individual users per day who
make billions of accesses per month.
Permission to make digital or hard copies of all or part of this work for personal or
classroom use is granted without fee provided that copies are not made or distributed
for profit or commercial advantage and that copies bear this notice and the full cita-
tion on the first page. Copyrights for components of this work owned by others than
the author(s) must be honored. Abstracting with credit is permitted. To copy other-
wise, or republish, to post on servers or to redistribute to lists, requires prior specific
permission and/or a fee. Request permissions from permissions@acm.org.
KDD’17, August 13–17, 2017, Halifax, NS, Canada.
© 2017 Copyright held by the owner/author(s). Publication rights licensed to ACM.
ISBN 978-1-4503-4887-4/17/08...$15.00
DOI: http://dx.doi.org/10.1145/3097983.3098108
KEYWORDS
News recommendations, Neural networks, Distributed represen-
tations, Large-scale services
1 INTRODUCTION
It is impossible for users of news distributions to read all avail-
able articles due to limited amounts of time. Thus, users prefer
news services that can selectively provide articles. Such selection
is typically done manually by editors and a common set of selected
stories are provided to all users in outmoded media such as tele-
vision news programs and newspapers. However, we can identify
users before they select articles that will be provided to them on
the Internet by using information, such as that in user ID cookies,
and personalize the articles for individual users [3, 22].
ID-based methods, such as collaborative filtering and low-rank
factorization, are well known in making recommendations. How-
ever, Zhong et al. [22] suggested that such methods were not suit-
able for news recommendations because candidate articles expired
too quickly and were replaced with new ones within short time
spans. Thus, the three keys in news recommendations are:
Understanding the content of articles,
Understanding user preferences, and
Listing selected articles for individual users based on con-
tent and preferences.
In addition, it is important to make recommendations in the real
world [14] that respond to scalability and noise in learning data
[14]. Applications also need to return responses within hundreds
of milliseconds with every user access.
A baseline implementation to cover the three keys would be as
follows. An article is regarded as a collection of words included
in its text. A user is regarded as a collection of words included
in articles he/she has browsed. The implementation learns click
probability using co-occurrence of words between candidates of
articles and browsing histories as features.
This method has some practical advantages. It can immediately
reflect the latest trends because the model is very simple so that
the model can be taught to learn and update in short periods of
time. The estimation of priority can be quickly calculated using
existing search engines with inverted indices on words.
KDD 2017 Applied Data Science PaperKDD’17, August 13–17, 2017, Halifax, NS, Canada1933�
The previous version of our implementation was based on this
method for these reasons. However, it had some issues that may
have had a negative impact on the quality of recommendations.
The first regarded the representation of words. When a word
was used as a feature, two words that had the same meaning were
treated as completely different features if the notations were differ-
ent. This problem tended to emerge in news articles when multiple
providers separately submitted articles on the same event.
The second regarded the handling of browsing histories. Brows-
ing histories were handled as a set in this approach. However, they
were actually a sequence, and the order of browsing should have
represented the transition of user interests. We also had to note
large variances in history lengths by users that ranged from pri-
vate browsing to those who visited sites multiple times per hour.
Deep-learning-based approaches have recently been reported
to be effective in various domains. Distributed representations of
words thoroughly capture semantic information [11, 16]. Recur-
rent neural networks (RNNs) have provided effective results as a
method of handling input sequences of variable length [9, 15, 17].
If we build a model with a deep network using an RNN to esti-
mate the degree of interest between users and articles, on the other
hand, it is difficult to satisfy the response time constraints on ac-
cesses in real systems. This paper proposes an embedding-based
method of using distributed representations in a three step end-
to-end manner from representing each article to listing articles for
each user based on relevance and duplication.
Start with distributed representations of articles based on
a variant of the denoising autoencoder (which addresses
the first issue in Section 3).
Generate user representations by using an RNN with brows-
ing histories as input sequences (which addresses the sec-
ond issue in Section 4).
Match and list articles for each user based on the inner
product of article-user for relevance and article-article for
de-duplication (outlined in Section 2).
The key to our method is using a simple inner product to es-
timate article-user relevance. We can calculate article representa-
tions and user representations before user visits in sufficient amounts
of time. When a user accesses our service, we only select his/her
representations and calculate the inner product of candidate arti-
cles and the representations. Our method therefore both expresses
complex relations that are included in the user’s browsing history
and satisfies the response time constraints of the real system.
The proposed method was applied to our news distribution ser-
vice for smartphones, which is described in the next section. We
compared our method to a conventional approach, and the results
(see Section 6) revealed that the proposed method outperformed
the conventional approach with a real service as well as with static
experimental data, even if disadvantages, such as increased learn-
ing time and large latency in model updates, are taken into con-
sideration.
2 OUR SERVICE AND PROCESS FLOW
The methods discussed in this paper were designed to be applied to
the news distribution service on the homepage of Yahoo! JAPAN
on smartphones. The online experiments described in Section 6
were also conducted on this page. This section introduces our ser-
vice and process flow.
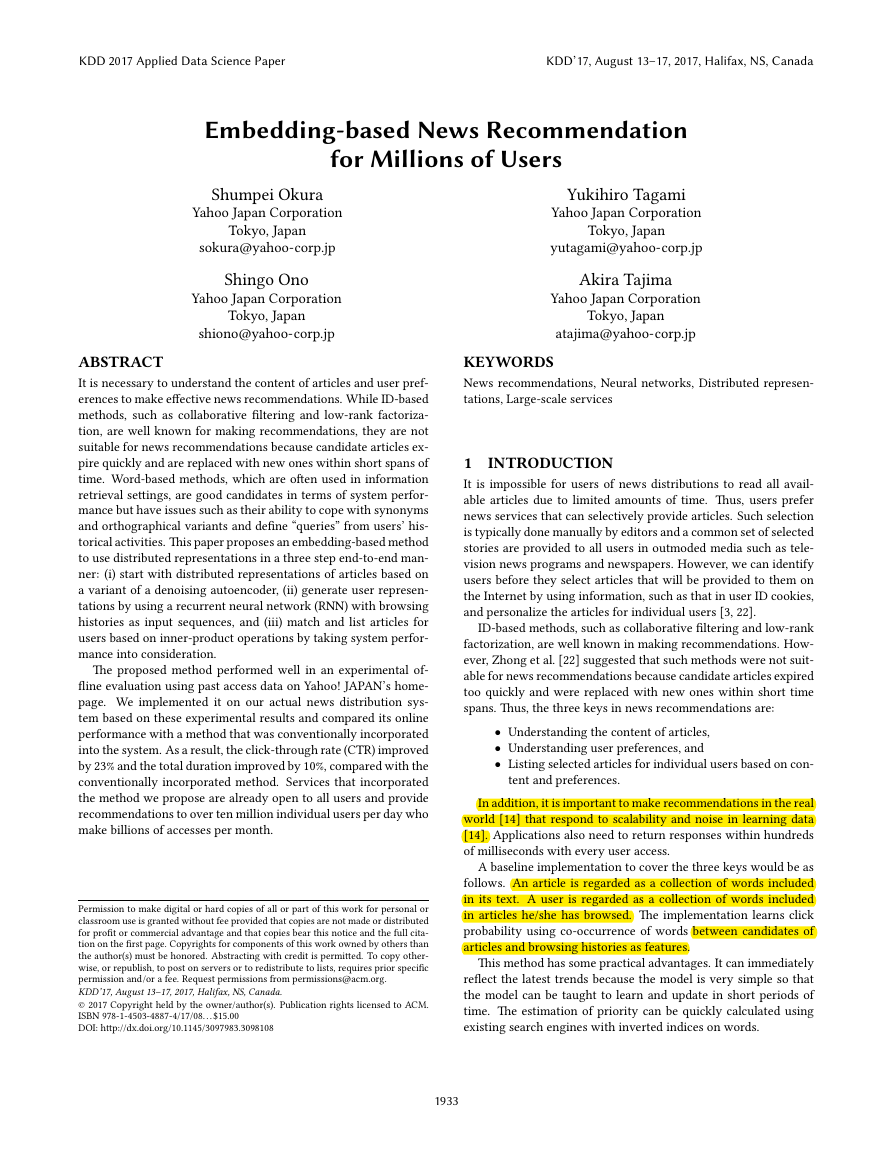
Figure 1: Example of Yahoo! JAPAN’s homepage on smart-
phones. This paper discusses methods of providing articles
in Personalized module.
Figure 1 has a mockup of our service that was renewed in May
2015. There is a search window and links to other services at the
top as a header. The middle part, called the Topics module, provides
six articles on major news selected by human professionals for a
general readership. The bottom part, called the Personalized mod-
ule, provides many articles and advertising that has been person-
alized for individual users. Users in the Personalized module can
see as many articles as they want if they scroll down to the bot-
tom. Typical users scroll down to browse the approximately top
20 articles. This paper describes optimization to provide articles in
the Personalized module.
tory in advance.
Five processes are executed to select articles for millions of users
Identify: Obtain user features calculated from user his-
Matching: Extract articles from all those available using
Ranking: Rearrange list of articles on certain priorities.
De-duplication: Remove articles that contain the same
Advertising: Insert ads if necessary.
information as others.
for each user access.
user features.
Header
Topics module
Personalized module
First view
KDD 2017 Applied Data Science PaperKDD’17, August 13–17, 2017, Halifax, NS, Canada1934�
These processes have to be done within hundreds of milliseconds
between user requests and when they are displayed because avail-
able articles are constantly changing. In fact, as all articles in our
service expire within 24 hours from the viewpoint of information
freshness, tens of thousands of new articles are posted every day,
and the same number of old articles are removed due to expira-
tion. Thus, each process adopts computationally light methods
that leverage pre-computed distributed article representations (de-
scribed in Section 3) and user representations (described in Section
4).
We use the inner product of distributed representations of a user
and candidate articles in matching to quantify relevance and se-
lect promising candidates. We determine the order of priorities
in ranking by considering additional factors, such as the expected
number of page views and freshness of each article, in addition
to the relevance used for matching. We skip similar articles in a
greedy manner in de-duplication based on the cosine similarity of
distributed representations. An article is skipped when the maxi-
mum value of its cosine similarity with articles with higher priori-
ties is above a threshold. This is an important process in real news
distribution services because similar articles tend to have similar
scores in ranking. If similar articles are displayed close to one an-
other, a real concern is that user satisfaction will decrease due to
reduced diversity on the display. Details on comparison experi-
ments in this process have been discussed in a report on our pre-
vious study [12]. Advertising is also important, but several studies
[2, 10] have already reported on the relationship between adver-
tising and user satisfaction, so such discussion has been omitted
here.
3 ARTICLE REPRESENTATIONS
Section 1 discussed a method of using words as features for an
article that did not work well in certain cases of extracting and
de-duplicating. This section describes a method of dealing with
articles as a distributed representation. We proposed a method in
our previous study [12], from which part of this section has been
excerpted.
3.1 Generating Method
Our method generates distributed representation vectors on the
basis of a denoising autoencoder [19] with weak supervision. The
conventional denoising autoencoder is formulated as:
where x 2 X is the original input vector and q(j) is the cor-
rupting distribution. The stochastically corrupted vector, ˜x, is ob-
tained from q(jx ). The hidden representation, h, is mapped from
˜x through the network, which consists of an activation function,
f (), parameter matrix W , and parameter vector b. In the same
way, the reconstructed vector, y, is also mapped from h with pa-
′. Using a loss function, LR (;), we learn these
rameters W
parameters to minimize the reconstruction errors of y and x.
′ and b
˜x q( ˜xjx )
h = f (W ˜x + b)
′
y = f (W
h + b
θ =
arg min
W ;W ′;b;b′
∑
′
)
x 2X
LR (y; x );
The h is usually used as a representation vector that corresponds
to x. However, h only holds the information of x. We want to in-
terpret that the inner product of two representation vectors h0Th1
is larger if x0 is more similar to x1. To achieve that end, we use
a triplet, (x0; x1; x2) 2 X 3, as input for training and modify the
objective function to preserve their categorical similarity as:
˜xn q( ˜xnjxn )
hn = f (W ˜xn + b) f (b)
yn = f (W
∑
′
hn + b
2∑
′
)
LT (h0; h1; h2) = log(1 + exp(h0
Th2 h0
(1)
Th1))
θ = arg min
W ;W ′;b;b′
(x0;x1;x2)2T
n=0
LR (yn; xn ) + αLT (h0; h1; h2);
whereT X 3, such that x0 and x1 are in the same category/similar
categories and x0 and x2 are in different categories. The h in Eq.1
satisfies the property, x = 0 ) h = 0. This means that an article
that has no available information is not similar to any other article.
The notation, LT (;;) is a penalty function for article similarity
to correspond to categorical similarity, and α is a hyperparameter
for balancing. Figure 2 provides an overview of this method.
Figure 2: Encoder for triplets of articles
We use the elementwise sigmoid function, σ (x )i = 1=(1+exp(xi )),
as f (), elementwise cross entropy as LR (;), and masking noise as
′g, by using mini-batch
q(j). We train the model, θ = fW ;W
stochastic gradient descent (SGD).
′; b; b
We construct ˜x in the application phase by using constant decay,
instead of stochastic corruption in the training phase, as:
˜x = (1 p)x
h = f (W ˜x + b) f (b);
where p is the corruption rate in the training phase. Thus, h is
uniquely determined at the time of application. Multiplying 1 p
has the effect of equalizing the input distribution to each neuron
in the middle layer between learning with masking noise and that
without the application of this noise.
We use the h generated above in three applications as the rep-
resentation of the article: (i) to input the user-state function de-
scribed in Section 4, (ii) to measure the relevance of the user and
the article in matching, and (iii) to measure the similarity between
articles in de-duplication.
h0h1h2Base article
Sim(h0,h1)Sim(h0,h2)Article in
similar category
Article in
different category
Encode
Decode
x0x1x2y0y1y2>
KDD 2017 Applied Data Science PaperKDD’17, August 13–17, 2017, Halifax, NS, Canada1935�
4 USER REPRESENTATIONS
This section describes several variations of the method to calculate
user preferences from the browsing history of the user. First, we
formulate our problem and a simple word-based baseline method
and discuss the issues that they have. We then describe some
methods of using distributed representations of articles, as was ex-
plained in the previous section.
4.1 Notation
Let A be the entire set of articles. Representation of element a 2 A
depends on the method. The a is a sparse vector in the word-based
method described in Section 4.2, and each element of a vector cor-
responds to each word in the vocabulary (i.e., x in Section 3). How-
ever, a is a distributed representation vector of the article (i.e., h
in Section 3) in the method using distributed representations de-
scribed in Sections 4.3 and 4.4.
(URL) of the page of an article. Let fau
ing history of user u 2 U .
Browse means that the user visits the uniform resource locator
2 Agt =1; ;Tu be the brows-
Session means that the user visits our recommendation service
t
and clicks one of the articles in the recommended list.
t and au
When u clicks an article in our recommendation service (a ses-
sion occurs), he/she will immediately visit the URL of the clicked
article (a browse occurs). Thus, there is never more than one ses-
t +1; therefore, this session is re-
sion between browses au
ferred to as su
t . However, u can visit the URL of an article without
t does not
our service, e.g., by using a Web search. Therefore, su
always exist.
Since a session corresponds to the list presented to u, we ex-
2 Agp2P . The notation,
press a session, su
P N, is the set of positions of the recommended list that is ac-
tually displayed on the screen in this session. Let P+ P be the
clicked positions and P = P n P+ be non-clicked positions. Al-
though P, P+, and P depend on u and t, we omit these subscripts
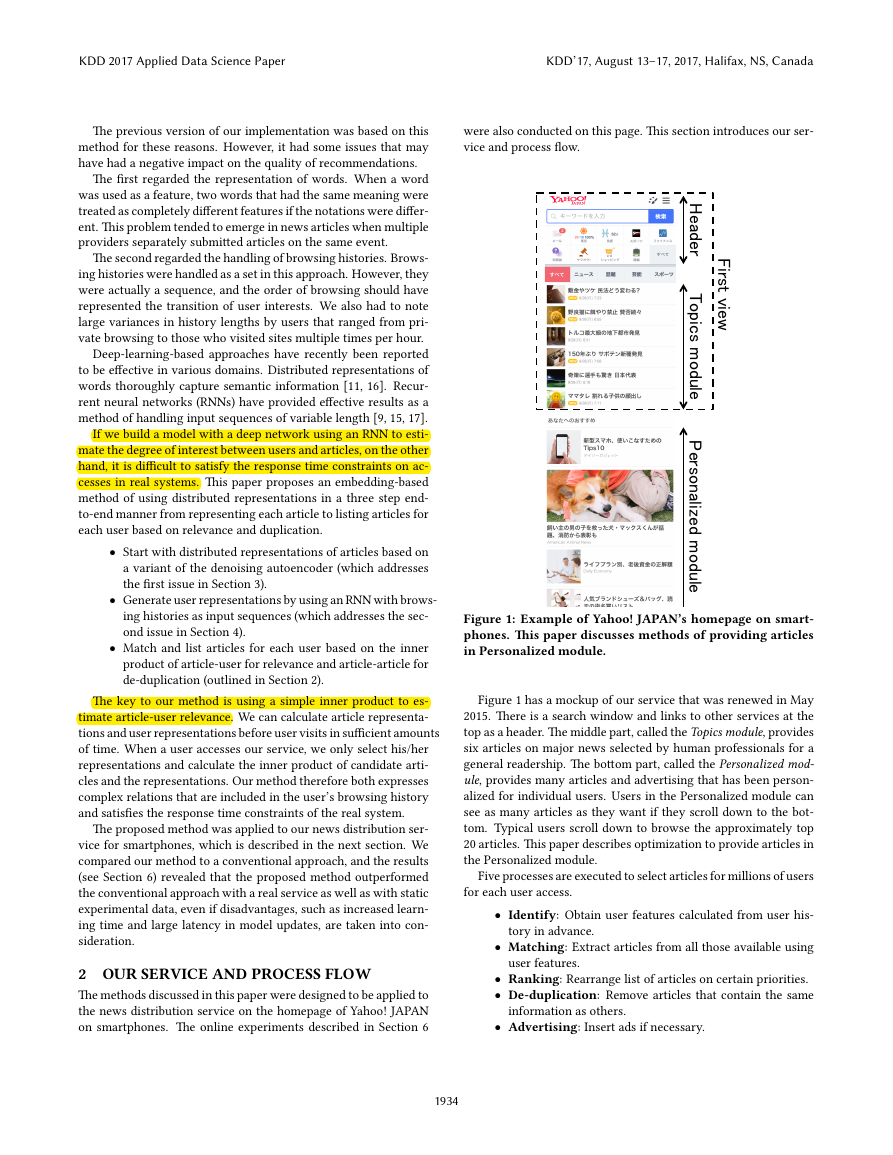
to simplify the notation. Figure 3 outlines the relationships be-
tween these notations.
t , by a list of articles fsu
t;p
Figure 3: Browsing history and session
1 ; ; au
Let ut be the user state depending on au
resents the preference of u immediately after browsing au
t , i.e., ut rep-
t . Let
R(ut ; a) be the relevance between the user state, ut , and the ar-
ticle, a, which represents the strength of u’s interest in a in time
t. Our main objective is to constitute user-state function F (; : : : ;)
and relevance function R(;) that satisfy the property:
8
su
t
8
p+ 2 P+
ut = F (au
1 ; : : : ; au
t )
8
p 2 P R(ut ; su
t;p+ ) > R(ut ; su
t;p ):
(2)
When considering the constrained response time of a real news
distribution system with large traffic volumes, R(;) must be a sim-
ple function that can be quickly calculated. Because candidate ar-
ticles are frequently replaced, it is impossible to pre-calculate the
relevance score, R(ut ; a), for all users fut ju 2 U g and all articles
fa 2 Ag. Thus, it is necessary to calculate this in a very short time
until the recommended list from visiting our service page is dis-
played. However, we have sufficient time to calculate the user state
function, F (; : : : ;), until the next session occurs from browsing
some article pages.
We restrict relevance function R(;) to a simple inner-product
t a, for these reasons and only optimize the
log(σ (R(ut ; su
relation, R(ut ; a) = uT
user state function, F (; : : : ;), to minimize the objective:
t;p )))
∑
∑
;
t;p+ ) R(ut ; su
jP+jjPj
(3)
su
t
p+2P+
p2P
where σ () is the logistic sigmoid function. Equation 4.1 is a relax-
ation of Eq. 2. As there is a bias, in practice, in the probability of
clicks depending on the displayed position when articles are ver-
tically arranged, we use the following objective including the bias
term, B(;), to correct such effects. Although B(;) is a parame-
∑
ter to be determined by learning, its description has been omitted
below since it is a common term in the models that follow.
t;p ) + B(p+; p)))
∑
log(σ (R(ut ; su
:
t;p+ ) R(ut ; su
jP+jjPj
su
t
p+2P+
p2P
4.2 Word-based Model
We formulate the word-based baseline model introduced in Section
1 as a baseline implementation on the basis of the notations in the
previous section.
Recall the three steps in the baseline implementation.
in its text,
An article is represented by a collection of words included
A user is represented by a collection of words included in
The relevance between the user and article is expressed by
a linear function on the co-occurrences of words between
them.
articles he/she has browsed, and
This model can be regarded as a special case of the notation in
the previous section, if article representation a and user function
F are defined as:
{
V : Vocabulary set
a; ut 2 f0; 1gV
1
(a)v =
0
(ut )v = (F (au
(if the article contains the word v)
(otherwise)
1 ; : : : ; au
t ))v = αv max
1t′t
t′ )v ;
(au
(4)
Browsing
history
Recommended
list
...Session
Clicked
Not
displayed
Not
clicked
Not
clicked
User
state
utaut�1autaut+1sutsut,1sut,2sut,3sut,NKDD 2017 Applied Data Science PaperKDD’17, August 13–17, 2017, Halifax, NS, Canada1936�
where (x )v is the v-th element of x. Then, the relevance function
becomes a simple linear model with parameters fαvg as:
R(ut ; a) = uT
t a
∑
∑
v2V
v2V
=
=
(ut )v (a)v
αv1v2ut\a :
There are two major issues with this model, as was explained in
Section 1.
The first is the sparseness of the representation. The R(ut ; a) in
this model increases if and only if ut and a contain the same words.
Thus, even if a user is interested in similar articles, the relevance
scores may greatly differ depending on whether they have been
written using the same words as the articles in his/her browsing
histories.
The second issue is intensity. Because the browsing history is
regarded as a set, the information about the browsing order and
frequency are lost. Thus, the model is very vulnerable to noise
that is mixed into the browsing history.
We describe other models by using distributed representations
by taking into account these issues in the subsections below.
4.3 Decaying Model
We introduce a simple model with distributed representations to
solve these issues. Two changes in this model from that of the
baseline are:
It uses the distributed representation constructed in Sec-
tion 3 as the representation vector, a, of an article, instead
of a bag-of-words (BoW) representation (which addresses
the first issue).
It uses the weighted average to aggregate browsing histo-
ries, instead of the maximum value. More specifically, we
increase the weights for recent browses and reduce the
weights for the previous days’ browses (which addresses
the second issue).
In summary, ut can be expressed as:
∑
ut = α ⊙
1
1t′t βtt′
′
βtt
au
t′;
∑
1t′t
t , ⊙
where α is a parameter vector that has the same dimension as au
is the elementwise multiplication of two vectors, and 0 < β 1 is
a scalar value that is a hyperparameter that represents the strength
of time decay. If β is 1, aggregation is the simple average, so that
the browsing order is not taken into consideration. Training pa-
rameters are only α in this model, which are similar to those in the
baseline model.
4.4 Recurrent Models
4.4.1
Simple Recurrent Unit. Although the decaying model in
the previous subsection took into account issues with the word-
based model, it had limitations such as being linear with respect to
frequency and that the forgetting effect was limited to exponential
decay with hyperparameters.
More generally, ut should be determined by a previous state,
ut1, and previous browse au
t as:
ut = f (au
t ; ut1):
Therefore, we try to learn this function by using an RNN. A simple
RNN is formulated by:
ut = φ (W inau
t + W outut1 + b);
where φ () is the activation function; therefore, we subsequently
use hyperbolic tangent function tanh(). Training parameters are
square matrices W in;W out , bias vector b, and initial state vector
u0 in this model, where u0 is a common initial value that does not
depend on u.
We learn these parameters by end-to-end mini-batch SGD with
the objective function in Eq. 4.1. However, when the input se-
quence is too long, simple RNN makes it too difficult to learn this
due to gradient vanishing and explosion problems [5]. Additional
structures that are attached to the hidden layer are able to alleviate
these problems in such cases.
The following subsections introduce two models that use such
structures.
4.4.2 Long-short Term Memory Unit. Long-short term memory
(LSTM) [6] is a well-known structure for vanishing and exploding
gradients [5]. We formulate an LSTM-based model as:
дi
t + W out
t + W out
t + W out
дi ut1 + W mem
дf ut1 + W mem
enc ut1 + benc )
дf
t + W out
дo ut1 + W mem
дo
hu
t1 + bдi )
hu
t1 + bдf )
hu
t + bдo )
(5)
(6)
= дit ⊙ enct + д ft ⊙ hu
t1
дi au
дf au
encau
дit = σ (W in
д ft = σ (W in
enct = φ (W in
hu
t
дot = σ (W in
дo au
dect = φ (W mem
dec hu
ut = дot ⊙ dect ;
t + bdec )
(7)
(8)
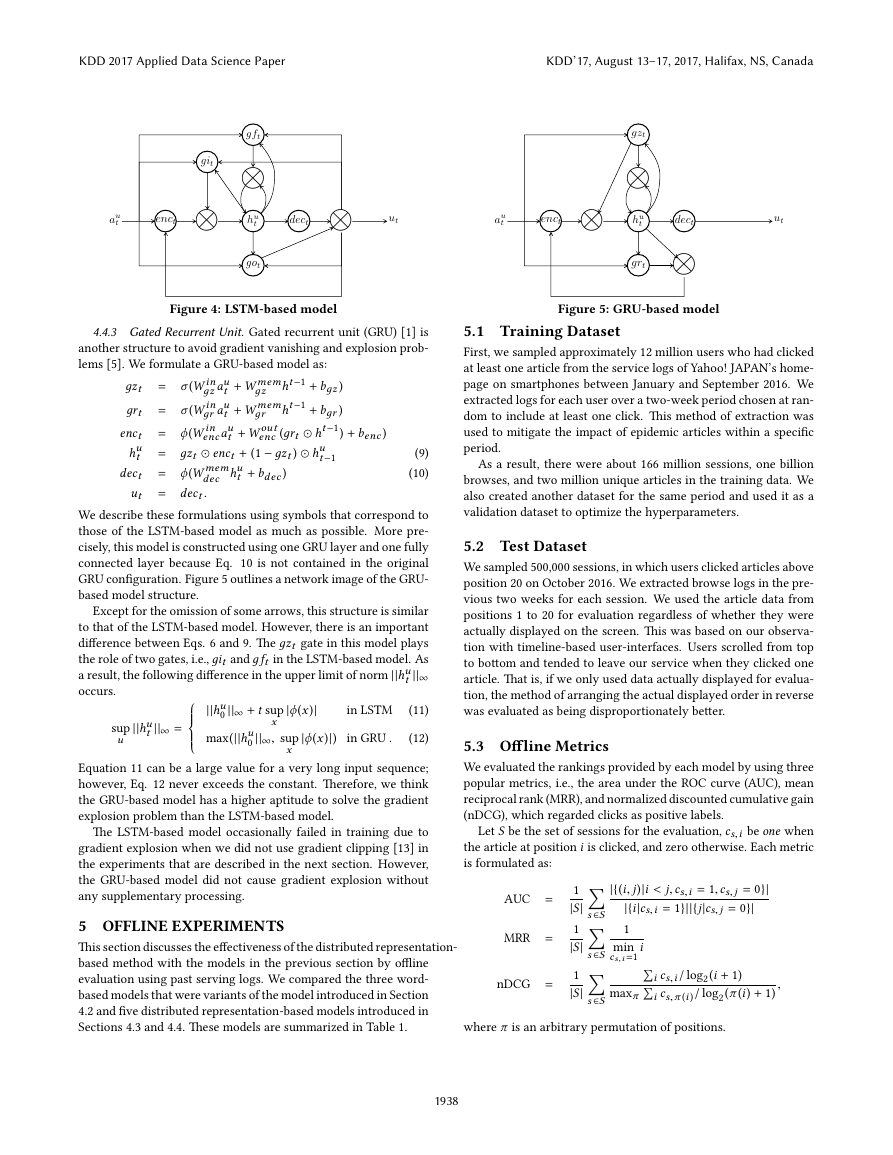
where σ () is the elementwise logistic sigmoid function, and hu
t
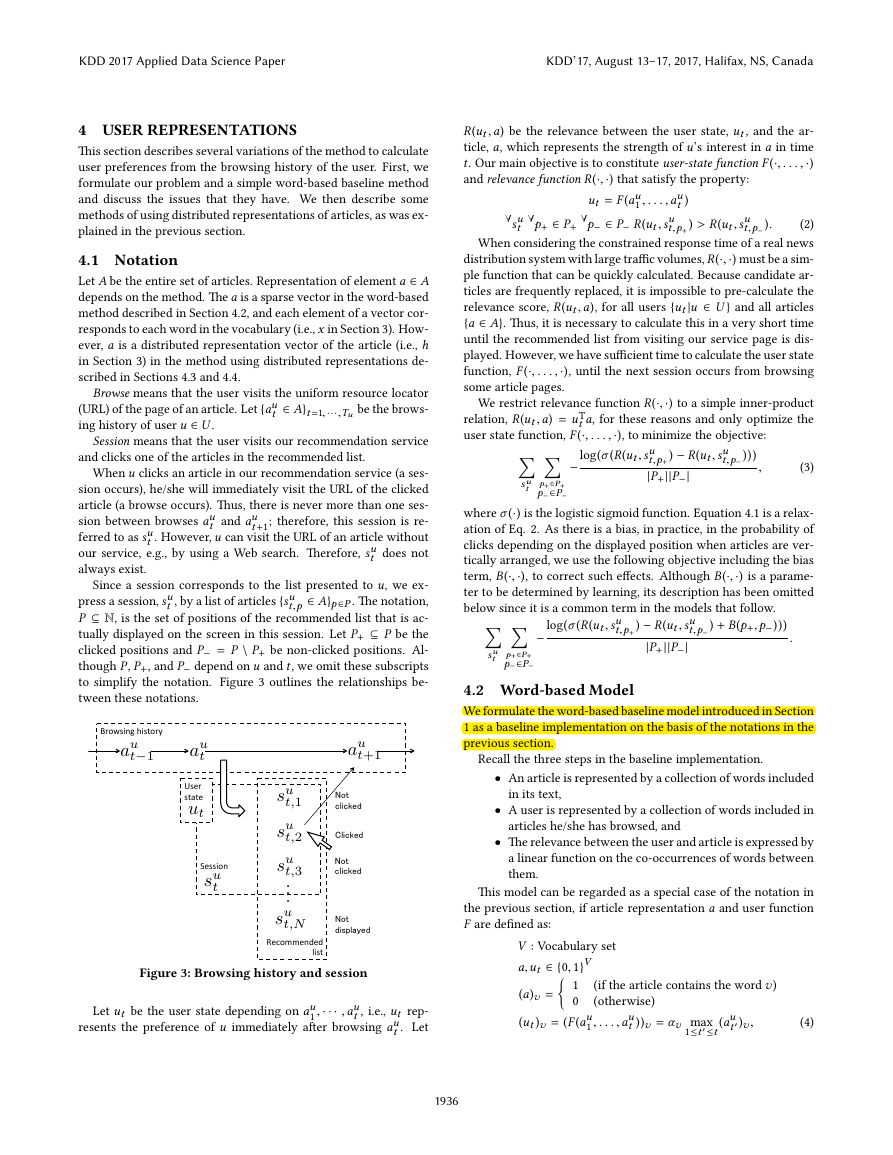
is a hidden memory state. Figure 4 has a network image of the
structure of the LSTM-based model.
The center flows are the main flows from input (browsed article)
to output (user state). The input, au
t , is encoded from article vector
space to hidden space (Eq. 5), merged into the previous hidden
state (Eq. 6), and decoded to the article vector space (Eq. 7, Eq. 8)
as the user state.
In addition, this unit has three gates, called input gate (дit ), for-
get gate (д ft ), and output gate (дot ). We assumed each gate would
conceptually play the following roles in this case. The input gate
filters unnecessary inputs to construct a user state, such as that
caused by sudden interest. The forget gate represents the decline
in interest by the user. It can represent a more complex forget-
ting effect than the exponential decay that is used in the decaying
model. The output gate filters components that should not be fo-
cused on in the next session.
, bias vectors b and
0 are
initial state vectors u0 and hu
common initial values that do not depend on u.
Training parameters are weight matricesW
0 in this model, where u0 and hu
KDD 2017 Applied Data Science PaperKDD’17, August 13–17, 2017, Halifax, NS, Canada1937�
Figure 4: LSTM-based model
4.4.3 Gated Recurrent Unit. Gated recurrent unit (GRU) [1] is
another structure to avoid gradient vanishing and explosion prob-
lems [5]. We formulate a GRU-based model as:
ht1 + bдz )
ht1 + bдr )
дz
t + W mem
t + W mem
t + W out
дr
enc (дrt ⊙ ht1) + benc )
дz au
дr au
encau
дzt = σ (W in
дrt = σ (W in
enct = φ (W in
hu
t
dect = φ (W mem
ut = dect :
= дzt ⊙ enct + (1 дzt ) ⊙ hu
t1
dec hu
t + bdec )
(9)
(10)
We describe these formulations using symbols that correspond to
those of the LSTM-based model as much as possible. More pre-
cisely, this model is constructed using one GRU layer and one fully
connected layer because Eq. 10 is not contained in the original
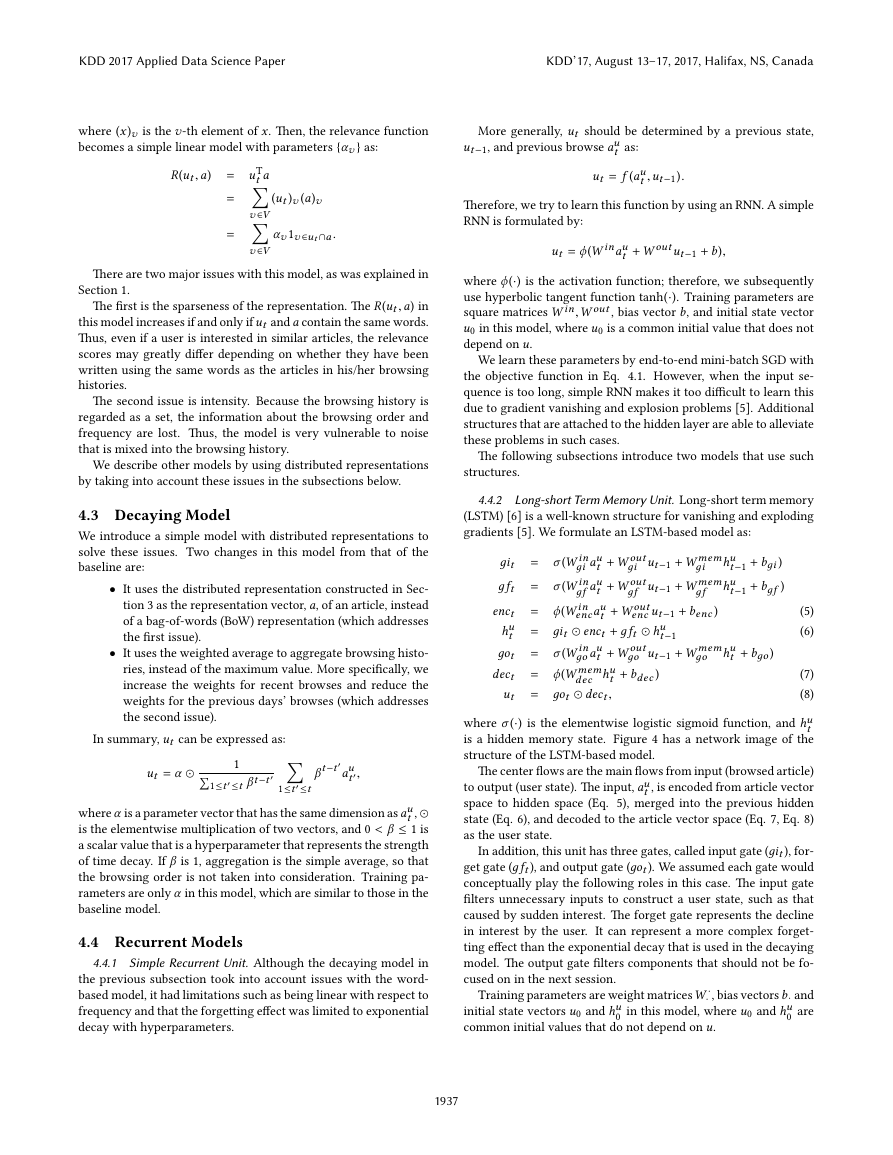
GRU configuration. Figure 5 outlines a network image of the GRU-
based model structure.
Except for the omission of some arrows, this structure is similar
to that of the LSTM-based model. However, there is an important
difference between Eqs. 6 and 9. The дzt gate in this model plays
the role of two gates, i.e., дit and д ft in the LSTM-based model. As
a result, the following difference in the upper limit of norm jjhu
jj1
occurs.
t
jjhu
t jj1 =
sup
u
jφ (x )j
0 jj1 + t sup
jjhu
max(jjhu
0 jj1; sup
x
jφ (x )j)
x
in LSTM (11)
in GRU .
(12)
8>>><>>>:
Equation 11 can be a large value for a very long input sequence;
however, Eq. 12 never exceeds the constant. Therefore, we think
the GRU-based model has a higher aptitude to solve the gradient
explosion problem than the LSTM-based model.
The LSTM-based model occasionally failed in training due to
gradient explosion when we did not use gradient clipping [13] in
the experiments that are described in the next section. However,
the GRU-based model did not cause gradient explosion without
any supplementary processing.
5 OFFLINE EXPERIMENTS
This section discusses the effectiveness of the distributed representation-
based method with the models in the previous section by offline
evaluation using past serving logs. We compared the three word-
based models that were variants of the model introduced in Section
4.2 and five distributed representation-based models introduced in
Sections 4.3 and 4.4. These models are summarized in Table 1.
Figure 5: GRU-based model
5.1 Training Dataset
First, we sampled approximately 12 million users who had clicked
at least one article from the service logs of Yahoo! JAPAN’s home-
page on smartphones between January and September 2016. We
extracted logs for each user over a two-week period chosen at ran-
dom to include at least one click. This method of extraction was
used to mitigate the impact of epidemic articles within a specific
period.
As a result, there were about 166 million sessions, one billion
browses, and two million unique articles in the training data. We
also created another dataset for the same period and used it as a
validation dataset to optimize the hyperparameters.
5.2 Test Dataset
We sampled 500,000 sessions, in which users clicked articles above
position 20 on October 2016. We extracted browse logs in the pre-
vious two weeks for each session. We used the article data from
positions 1 to 20 for evaluation regardless of whether they were
actually displayed on the screen. This was based on our observa-
tion with timeline-based user-interfaces. Users scrolled from top
to bottom and tended to leave our service when they clicked one
article. That is, if we only used data actually displayed for evalua-
tion, the method of arranging the actual displayed order in reverse
was evaluated as being disproportionately better.
5.3 Offline Metrics
We evaluated the rankings provided by each model by using three
popular metrics, i.e., the area under the ROC curve (AUC), mean
reciprocal rank (MRR), and normalized discounted cumulative gain
(nDCG), which regarded clicks as positive labels.
Let S be the set of sessions for the evaluation, cs;i be one when
the article at position i is clicked, and zero otherwise. Each metric
is formulated as:
∑
∑
∑
s2S
s2S
s2S
AUC =
MRR =
nDCG =
1
jSj
1
jSj
1
jSj
jf(i; j)ji < j; cs;i = 1; cs; j = 0gj
jfijcs;i = 1gjjfjjcs; j = 0gj
1
∑
min
∑
cs;i =1 i
i cs;i = log2(i + 1)
i cs;π (i )
maxπ
= log2(π (i) + 1)
;
where π is an arbitrary permutation of positions.
⌦⌦⌦gitgftgotenctdectuthutaut⌦⌦enctdectuthut⌦gztgrtautKDD 2017 Applied Data Science PaperKDD’17, August 13–17, 2017, Halifax, NS, Canada1938�
The AUC is the metric directly related to the objective of train-
ing (see Eq.2). The MRR and nDCG are popular ranking metrics;
the former focuses on the first occurrence of positive instances,
and the latter evaluates ranks for all the positive instances. Each
metric is a value between zero and one, which is calculated as the
average score for each session; i.e., the larger the better.
5.4 Models and Training
We evaluated the eight models listed in Table 1.
Table 1: Model descriptions
Description
Name
BoW The simplest word-based model
Section
4.2
4.2
+α
4.2
+α
4.3
4.3
4.4.1
4.4.2
4.4.3
BoW-Ave Word-based model that uses average func-
tion instead of max in Eq.4
BoW-Dec Word-based model that uses decayed aver-
age function with β = 0:9 similar to that
introduced in Section 4.3
Average Decaying model with β = 1 (no decaying)
Decay
RNN
LSTM
GRU
Decaying model with β = 0:9
Recurrent model using simple RNN unit
Recurrent model using LSTM-based unit
Recurrent model using GRU-based unit
As was described in Section 4.2, word-based models can be re-
garded as simple linear logistic regressions for pairwise data with
sparse feature vectors, like the ranking support vector machine
(SVM) [7]. Thus, we used LIBLINEAR [4] for training L2-regularized
logistic regression (solver type 0).
We used mini-batch SGD with RMS-prop to adjust the learn-
ing rate for the other models. The mini-batch size was 20 and the
initial learning rate was 0.005. The numbers of dimensions of the
distributed representations of article a and user state ut were 500.
The number of dimensions of internal state hu
t was 200 in LSTM
and GRU. These parameters were determined by using the devel-
opment dataset.
We used the gradient clipping technique [13] to avoid gradient
explosion in RNN and LSTM. GRU did not cause gradient explosion
when this technique was not used in these experiments.
5.5 Experimental results
Table 2 lists all metrics used in the experiments. We split the test
dataset into ten sub-datasets and calculated each metric per sub-
dataset. The values in Table 2 are the averages for each metric of
the sub-datasets and each metric’s 99% confidence intervals that
were estimated based on the t-distribution.
GRU had the best score for all metrics with a sufficient margin,
and it yielded a significant difference against all other models ac-
cording to a paired t-test with p < 0:01.
Because Average exhibited a significant improvement from BoW-
Ave, distributed representations of articles should work better than
BoW representations.
Decay and BoW-Dec were worse than Average and BoW-Ave. This
suggests that browsing-order information cannot be expressed with
simple attenuation. RNN also exhibited a slight improvement on
Table 2: Results from offline experiments. Values indicate
average of metrics and 99% confidence intervals in ten split
test sets.
BoW
BoW-Ave
BoW-Dec
Average
Decay
RNN
LSTM
GRU
AUC
0.582 0.003
0.579 0.004
0.560 0.004
0.608 0.003
0.596 0.003
0.612 0.004
0.648 0.004
0.652 0.003
MRR
0.300 0.003
0.310 0.003
0.297 0.004
0.313 0.003
0.302 0.002
0.309 0.004
0.344 0.004
0.347 0.004
nDCG
0.446 0.002
0.452 0.002
0.442 0.003
0.457 0.002
0.449 0.001
0.455 0.003
0.481 0.003
0.484 0.003
AUC against Average. However, LSTM and GRU were significantly
better than Average. We believe this was because it was able to ex-
press more complex relations for the order of browsing sequences
by using the gate structures in these models.
6 DEPLOYMENT
We began using GRU on December 2016 for the main traffic in our
service (which we denoted the Proposed bucket). However, we
continued to apply the conventional BoW model to 1 % of users to
enable comparisons of performance (which we denoted the Con-
trol bucket). This section reports the results obtained from com-
parisons after deployment.
6.1 Settings
Our system presents articles to users who visit our service page
according to a three step procedure.
The user state, ut , of each model should be calculated from
the browsing history in advance.
When user u visits our service, we calculate the relevance
t a, for all articles a that were newly
We present the articles to the user in order from the high-
scores, R(ut ; a) = uT
published within a certain period of time.
est relevance score by applying de-duplication.
The representation of ut and a for relevance scores depends on
the bucket. We applied de-duplication by using the distributed rep-
resentations described in Section 2 to both Control and Proposed
buckets. As the effects of de-duplication on users are not discussed
here, refer to our past paper [12] for details on an experiment on
these effects.
We can identify the user from browser cookies in addition to
the ID for login. Therefore, we can extract some histories for most
users including those who are not logged in. However, there are
some users who have no history such as new users or who have
been privately browsing. Although we can provide articles to them
with other methods by using popularity, diversity, and freshness,
instead of relevance scores, all results on them have been excluded
from the following reports.
6.2 Online Metrics
The list below represents the four online metrics we used.
Sessions The average number of times one user utilized our
service per day.
KDD 2017 Applied Data Science PaperKDD’17, August 13–17, 2017, Halifax, NS, Canada1939�
Table 3: Average metric lift rates in 7th week and those by
user segments.
Table 4: Average daily percentage of user composition in 7th
week for both buckets.
Metric
Sessions
Duration
Clicks
CTR
Heavy Medium Light
ALL
+1:1%
+1:8%
+1:0%
+2:3%
+13:3% +17:4%
+7:8%
+4:9%
+26:3% +42:3%
+19:1% +14:3%
+23:0% +18:7%
+29:8% +45:1%
Duration The average time (in seconds) that the user spent
with our service per session. It was the total time the user
took looking at the recommendation list and the time it
took him/her to read the article after clicking on it.
responded to jP+j in Section 4).
Clicks The average number of clicks per session (which cor-
Click through rate (CTR) Clicks/number of displayed ar-
ticles. These were decreased if article retrieval became in-
efficient and users spent more time exploring the recom-
mendation list.
A session in this section means the collection of accesses by a
user. It is regarded as another session if there is a gap of more than
10 min between accesses.
Our most important metric is the total duration per user, which
is the product of Sessions and Duration.
6.3 Experimental Results
The results obtained from comparison are summarized in Figure 6
and Table 3.
Figure 6 plots the daily transition in the lift rate of each metric
(i.e., that with the Proposed and metric with Control). All metrics
improved significantly with the Proposed bucket. Duration, Clicks,
and CTR indicated a certain rate of improvement from the first
day the new model was applied. However, Sessions demonstrated
a relatively small rate of improvement on the first day but grad-
ually improved a great deal. This meant that a good recommen-
dation model first increases clicks, and multiple click experiences
encourage users to gradually use the service more frequently.
Table 3 summarizes the average metric lift rates in the seventh
week and those by user segments split according to the frequency
of visits. The definitions for segments are three fold. The user com-
position ratios are roughly Heavy : Medium : Liдht = 3 : 2 : 1.
during the previous week.
Heavy: Users who have visited for more than five days
Medium: Users who have visited for between two and five
Light: Users who have visited for less than two days dur-
days during the previous week.
ing the previous week.
Improvements in the metrics were confirmed for all segments.
Light users demonstrated particularly large improvement rates.
Therefore, we derived the following hypotheses. Users who had lit-
tle history were strongly influenced by feature sparsity if we used
BoW representations. Also, some noisy browsing caused by sud-
den interest seriously affected the accuracy of recommendations.
Our method with the GRU-based model might successfully pre-
vent these problems with distributed representations and the gate
structures of GRU. This is why the Proposed bucket worked better
Bucket
Control
Proposed
ALL (%) Heavy (%) Medium (%)
33:9
33:6
34:3
Light (%)
16:1
15:0
0th week (ref.)
16:0
than the Control bucket with the word-based model, especially for
light users.
100:0
100:0
100:0
50:0
51:4
49:7
In addition to the improvement in metrics within each segment,
we also observed a shift in users from Light to Medium, and Medium
to Heavy, as listed in Table 4. This is why the overall rate of in-
crease in Sessions was higher than the increase in each segment in
Table 3.
6.4 Deployment challenges to large-scale
deep-learning-based services
It is very important to keep updating models with the latest data
when applying machine learning to actual news distribution sys-
tems. In fact, the Control bucket described in the previous section
uses the latest article data and session data every three hours to up-
date the model. The Proposed bucket using the GRU-based model,
on the other hand, could not update the model as frequently due
to four reasons.
It takes a long time to learn the model. In fact, the model
actually used in main traffic is calculated over a week us-
ing GPU.
If we update the article-representation model (discussed in
Section 3), we have to re-calculate representations for all
available articles and re-index to the article search engine.
If we update the user-representation model (discussed in
Section 4), we have to re-calculate the user state from the
first browse in the past. In practice, there is no choice but
to give up on re-calculating old histories over a certain
period of time.
The data store holding the user representations and the
search index holding the article representations must be
synchronously updated.
Therefore, we prepared two identical systems and switched them
alternately to update the model once every two weeks. Of course,
adding fresh articles and updating user states by users’ browsing
are executed more frequently because they require fewer calcula-
tions than those for updating models.
As word-based models in our experience have responded sensi-
tively to buzz-words, they deteriorate as soon as a few days after
stops have been updated; however, the distributed representation-
based model maintains sufficient accuracy at this frequency of model
updates. When we left the GRU-based model for about three months,
it had deteriorated to the same accuracy as the word-based model
with updates every three hours in experiments without model up-
dates.
7 RELATED WORK
This section presents related work to our proposed approach.
We generated distributed representations of articles by using a
denoising autoencoder with weak supervision, as described was
KDD 2017 Applied Data Science PaperKDD’17, August 13–17, 2017, Halifax, NS, Canada1940�





 2023年江西萍乡中考道德与法治真题及答案.doc
 2012年重庆南川中考生物真题及答案.doc
 2013年江西师范大学地理学综合及文艺理论基础考研真题.doc
 2020年四川甘孜小升初语文真题及答案I卷.doc
 2020年注册岩土工程师专业基础考试真题及答案.doc
 2023-2024学年福建省厦门市九年级上学期数学月考试题及答案.doc
 2021-2022学年辽宁省沈阳市大东区九年级上学期语文期末试题及答案.doc
 2022-2023学年北京东城区初三第一学期物理期末试卷及答案.doc
 2018上半年江西教师资格初中地理学科知识与教学能力真题及答案.doc
 2012年河北国家公务员申论考试真题及答案-省级.doc
 2020-2021学年江苏省扬州市江都区邵樊片九年级上学期数学第一次质量检测试题及答案.doc
 2022下半年黑龙江教师资格证中学综合素质真题及答案.doc