Correspondence
Toward UAV Control via Cellular Networks: Delay
Profiles, Delay Modeling, and a Case Study Within the
5-mile Range
While some unmanned aerial vehicles (UAVs) can operate with a
given degree of autonomy (e.g., path following, obstacle avoidance,
auto return, and other flight modes), many civilian drones have a
safety pilot standby all the time for abnormal conditions. This is
typically done within line-of-sight (LOS) due to regulations. While
flying within LOS, radio frequency communication remains a popu-
lar alternative for retail pilots. For beyond line of sight operations,
given the availability of cellular technologies, the UAV community
has explored the possibility of using the cellular network instead,
which could bring benefits such as an additional channel for control
and telemetry, extension of range, and allowing the UAV to interact
with cloud services while it flies, via a data connection. With the
current prevalence of data supporting communication over 3G and
4G networks, the following representative technologies have been used
for long-distance control—short message service (SMS), transmission
control protocol (TCP), message queue telemetry transport (MQTT),
and the so-called “protocol-independent” service PubNub. While the
safety of drone flights is highly prioritized by regulators, the issue
becomes even more highlighted when control commands are transmit-
ted via cellular network channels (e.g., 4G long-term evolution, SMS)
which can introduce time delays in communication chains and degrade
pilot’s ability to properly control UAVs. This article reviews common
UAV communication protocols over cellular links and presents a
technique for measuring and modeling delays over such channels.
The quality-of-fit for the proposed models is measured for different
communication protocols, short versus long-range communication,
and different UAV operation modes. Finally, details are presented for
a system that manipulates a drone via the cellular network and latency
is measured for such system.
I.
INTRODUCTION
Drones operated by civilians are often radio-controlled
and the flight is limited to line-of-sight (LOS) range in order
to comply with regulations. Besides radio, other technolo-
gies such as cellular can also provide a communication link
[1], [2]. In fact, integration of unmanned aerial vehicles
(UAVs) with the cellular network is a topic of ongoing re-
search, with researchers interested in using drones as relays
and base stations (BSs), but also interested in providing
Manuscript received March 21, 2019; revised June 14, 2019, September
16, 2019, and January 16, 2020; released for publication March 17, 2020.
Date of publication April 22, 2020; date of current version October 9, 2020.
DOI. No. 10.1109/TAES.2020.2987406
Refereeing of this contribution was handled by R. Wang.
This work was supported in part by the gift from Mr. and Mrs.
J. Bodenstedt.
Authors’ addresses: Jafet Morales, Gerson Rodriguez, and David Akopian
are with the University of Texas at San Antonio San Antonio, TX 78249
(jafet.aaron.morales@gmail.com; gerson.rodriguez.gr
USA, E-mail:
@gmail.com; David.Akopian@utsa.edu); Grant Huang
is with
the University of Florida Gainesville, FL 32611 USA, E-mail:
(Grant.Huang@ieee.org). (Corresponding author: Jafet Morales.)
0018-9251 © 2020 IEEE
4132
IEEE TRANSACTIONS ON AEROSPACE AND ELECTRONIC SYSTEMS VOL. 56, NO. 5 OCTOBER 2020
Authorized licensed use limited to: CHONGQING UNIVERSITY. Downloaded on November 23,2020 at 14:36:36 UTC from IEEE Xplore. Restrictions apply.
�
communication services to UAVs via the cellular network.
There are challenges, given that drones may be in LOS with
a large number of BSs and that the BSs are down tilted to
service equipment on the ground [3]. A study by the Third
Generation Partnership Project (3GPP) [4], the enhanced
LOS between aerial user equipment and ground BSs would
significantly increase interference in the system.
The increased use of cellphones and the availability of
the Internet have popularized many communication tech-
nologies. As such, the community has attempted to use these
technologies to control or monitor drones. Given that the
type of control in previous studies is so varied (e.g., autopilot
low-level control, high-level guidance), we refer to remote
UAV control in a general manner, as the commanding or di-
recting of the UAV’s behavior by a remote agent. However,
even though the focus of this research is on the communica-
tion aspect, the possible effects of control implementation
details on communication delays are also discussed.
The use of short message service (SMS) messaging
in consumer-grade drone control is reported in [5] and
telemetry in [6], but there are alternatives with lower latency,
if a connection to the Internet (i.e., a mobile data plan) is
available. Recently, consumer Internet-of-Things (IoT) and
Industrial Internet-of-Things (IIoT) protocols are becoming
popular as they facilitate real-time data gathering and distri-
bution. These protocols can be applied to control or monitor
many devices, from lightbulbs to refrigerators. In particular,
the MQTT protocol designed for IoT [7], [8], can be applied
for UAV control as well. There are also proprietary Appli-
cation Programming Interfaces (APIs) and software devel-
opment kits (SDKs) that can facilitate messaging, such as
PubNub, which claims to have low latency, high reliability,
low cost, and low development time. PubNub can be seen as
a higher level protocol that can adapt the connectivity based
on the “best” protocol available in a given environment
[9]. Another proprietary solution goes as far as providing a
modem so that devices such as microcomputers can have a
cellular data connection to the Internet [10].
The problem of communication delays (latency) has
been recognized in the IoT community, prompting some
to embark on delay measurement campaigns. In [11], the
authors used inexpensive, industrial grade IIoT devices and
free access servers to measure roundtrip latency of 300 ms
when an initiator node was placed in Europe and a partner
node in South America, and 600 ms vice versa. In both cases,
the standard deviation was less than 30 ms, which may also
be relevant for some applications. While the communication
delays are studied in the IoT field [11], a rigorous study of
delays for drone communication over cellular networks for
various protocols or solutions is not reported.
High latency on drone control may have a detrimental
effect on the safety of the drone and its environment. As an
example, if a drone moving at 15 m/s encounters an obstacle
in a scenario with an end-to-end latency of 117 ms for video
transmission to ground control, 250 ms pilot response time,
and 75 ms delay in the control channel, the drone will have
moved 6.6 m when it receives the control signal to avoid
the obstacle. Beyond visual line-of-sight drone operation
often employs an on-board camera. Additional autonomy
features for sensing and avoiding obstacles may be used
for safety. Latency in video streaming is caused by frame
capture, compression or encoding, transmission, network
delay, reception, decompression or decoding, and display.
This chain of delays can be denoted T = Tcap + Tenc + Ttx +
Tnw + Trx + Tdec + Tdisp. When it comes to encoding, the
concept of slices has been introduced in the H.264 standard,
which allows for division of a single frame into slices which
can be encoded individually, so that transmission does not
have to start until the entire frame has been encoded [12].
This article will study delays for certain technologies
that have been used in a drone control and/or telemetry
setting. The contributions of this article are as follows.
1) review of common UAV communication techniques
over cellular links;
2) a technique for measuring communication delays;
3) a technique for modeling the delays using mixture
distributions, which can be used to simulate delays;
4) the details of an implementation in which a drone is
manipulated via the cellular network and the com-
munication delays are measured.
The rest of this article is organized as follows. In Sec-
tion II, different messaging technologies are described, as
well as the causes for end-to-end messaging delays. Sec-
tion III describes a mobile phone setup which can be used to
measure the delays for different protocols, independently of
the UAV setup. Section IV proposes a method for modeling
end-to-end delays in messaging networks. Section V ana-
lyzes the results by comparing the quality-of-fit for different
models. Section VI explores the adaptiveness of the model
to the effects of UAV operation. Section VII discusses the
strengths and weaknesses of the models from Section VI.
Section VIII presents the implementation of a round-trip
latency (RTL) measurement system that uses a drone, a
cellular modem, and a workstation to control the drone and
measure delays. Section IX discusses the drawbacks of the
proposed cellular remote control and latency measurement
system. Finally, Section X concludes this article.
II. CELLULAR
COMMUNICATION
TECHNOLO-
GIES USED FOR DRONE CONTROL AND/OR
TELEMETRY
A. Transmission Control Protocol
The transmission control protocol (TCP) is one of the
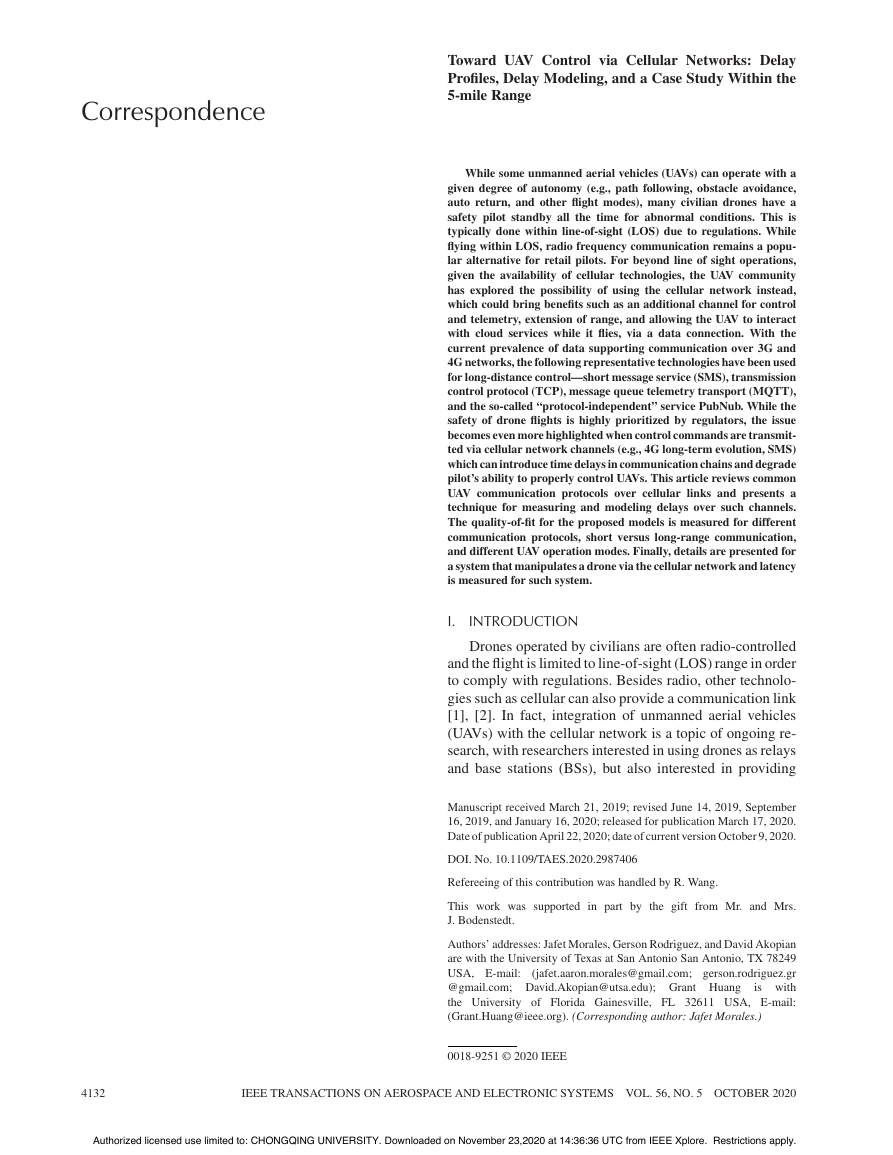
protocols in the Internet protocol (IP) suite (see Fig. 1). Us-
ing a TCP/IP connection is one way to control a consumer-
grade drone. The setup in [13] uses a 4G long-term evolution
(LTE) cellular + WiFi modem that connects to compatible
drones. On the ground station, an application provides a
TCP and user datagram protocol (UDP) data stream to
interact with the modem. In this case, the application allows
for drone control beyond LOS and telemetry that includes
image streaming.
The TCP protocol takes packets from an upper layer
protocol such as hypertext transfer protocol (HTTP) or
CORRESPONDENCE
4133
Authorized licensed use limited to: CHONGQING UNIVERSITY. Downloaded on November 23,2020 at 14:36:36 UTC from IEEE Xplore. Restrictions apply.
�
Fig. 1.
IP suite.
MQTT. It includes its own protocol data with each packet
such as source and destination ports, sequence number, and
checksum. It will hand down its packets to a protocol at
the network layer, such as the IP, which will exchange
the data using its own protocol packets (IP datagrams),
which include additional data such as source and destination
IP address, and sequence numbers if the data had to be
fragmented into different packets. Using this information,
network routers will be able to route the IP packets to the
destination network. Once a packet has reached a router
whose network includes the destination IP, other protocols
will be used to exchange the data with the destination
machine. The destination IP address will be converted to the
hardware address of the destination machine by using the
Address Resolution Protocol, and network interfaces and
drivers will be used to exchange the packets. The receiving
host will move the data between each layer all the way
up to the application layer, with each protocol removing its
protocol data and reassembling packets that it disassembled,
if necessary.
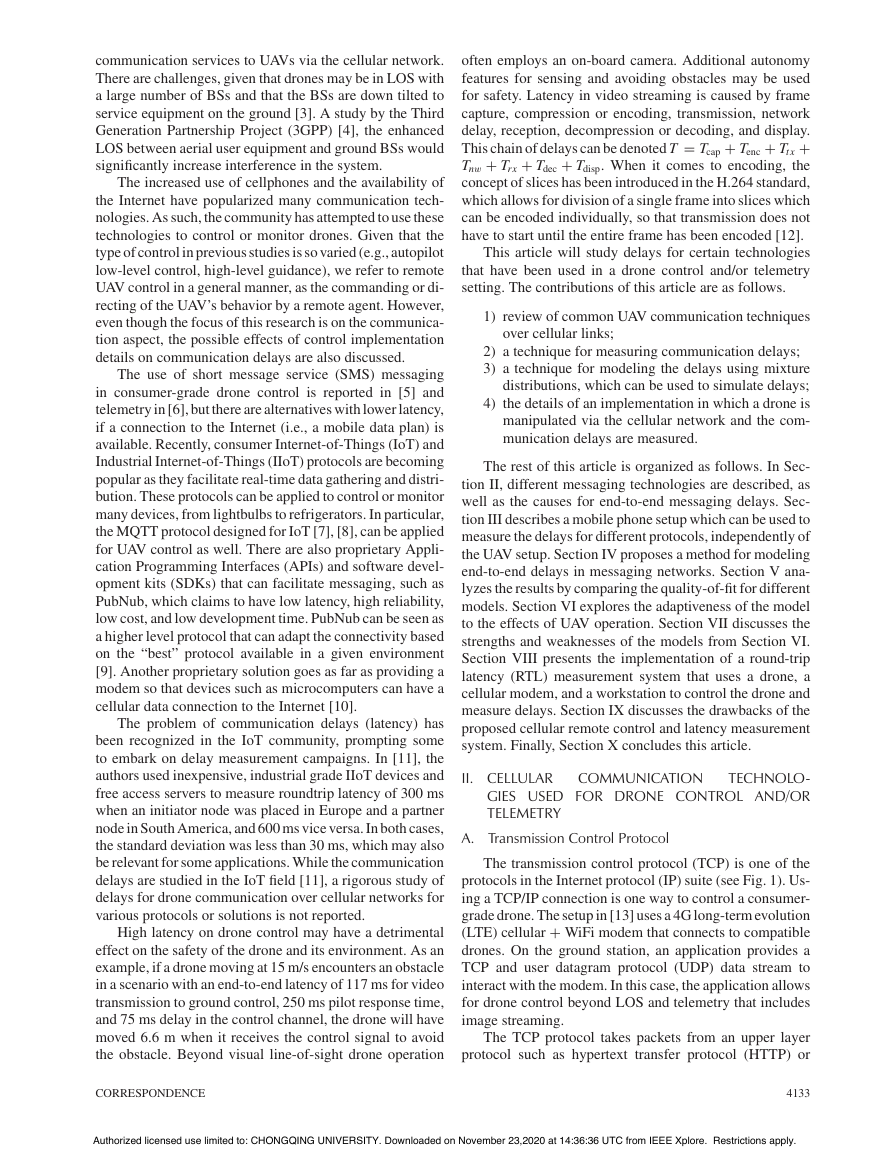
TCP connections are managed using sockets. API func-
tion calls are used during a connection-oriented socket
session (14) (see Fig. 2). The TCP round trip time is the time
it takes for an acknowledgement TCP packet to be received
after a data packet is sent. After a certain delay threshold,
operating systems may drop the session. Abnormal delays
may be due to congestion in a network. The authors of
[15] created a script in the Bro intrusion detection system
to analyze active TCP sessions. Their method analyzes
abnormal delays to determine if the network is congested.
It can be deployed on a computer connected to a gateway
router, on a server, or on a client. There are also datasets for
performing this type of studies [16].
One drawback of using a network protocol that de-
pends on acknowledgement signals, such as TCP, is that
the protocol may collapse the network when the network is
Fig. 2. Socket session function calls.
congested, unless congestion control measures are applied.
Collapse due to congestion may occur when the network
delays go above a certain limit, and TCP retransmission
timeouts start expiring. This triggers an avalanche of re-
transmissions of packets which only increases congestion
and reduces throughput even further. Congestion control
algorithms have been designed to solve this problem [17].
B. Message Queue Telemetry Transport
The message queue telemetry transport (MQTT) pro-
tocol was intended for unreliable networks with low band-
width and high latency. The setup described in [18] proposes
4134
IEEE TRANSACTIONS ON AEROSPACE AND ELECTRONIC SYSTEMS VOL. 56, NO. 5 OCTOBER 2020
Authorized licensed use limited to: CHONGQING UNIVERSITY. Downloaded on November 23,2020 at 14:36:36 UTC from IEEE Xplore. Restrictions apply.
�
Tcpdump [22] to save the packets to Pcap files and then ana-
lyze the files using Wireshark. For higher payload sizes, the
end-to-end delay increases due to the payload being divided
into TCP packets and the overhead that this fragmentation
adds. The maximum packet size for MQTT is 256 MB [23].
This is higher than the maximum of 65 535 bytes packet size
for TCP. Fragmentation of the TCP packets themselves may
also occur at lower layers of the protocol stack with a lower
maximum transmission unit, such as ethernet.
MQTT for sensor networks (MQTT-SN) is a variant of
MQTT. MQTT relies on TCP for data transmission. MQTT-
SN, on the other hand, does not rely on TCP, as it is aimed
at embedded devices that are not connected via TCP, such
as ZigBee or devices connected via UDP. For MQTT, TCP
handles some of the work, such as fragmentation and error
correction. But if TCP is not available, MQTT-SN may be
used. MQTT-SN does not support fragmentation, so packet
size is limited to that supported by the underlying network.
The specification for MQTT and MQTT-SN are similar, but
not exactly the same. For example, MQTT-SN supports a
QOS Level -1. For more information, the reader is referred
to [24], [25]. For drone communication beyond LOS via
the cellular network, MQTT may be preferred if a TCP
connection is being used. For LOS communication without
a TCP connection (e.g., Zigbee), MQTT-SN would be the
only possible alternative between the two protocols. In such
cases, this also eliminates some of the overhead due to TCP.
C. PubNub Messaging Network
PubNub is a messaging framework that claims to use
the best protocol to get connectivity in any environment
[9]. In this case, the developer uses a client library with a
level of abstraction in which a protocol does not need to be
specified. PubNub is an IaaS platform that allows real-time
messaging using a publish/subscribe API. PubNub claims to
send messages at 250 ms. The API is relatively easy to use,
and the amount of coding required is minimal (compared to
TCP, for example). When a device publishes/subscribes to
an end point, a “channel” is created. The number of channels
that can be created is practically unlimited, which can make
it easy to segregate the data.
PubNub has been used for consumer-grade drone con-
trol. The setup in [26] uses a WiFi/LTE hotspot mounted
on the drone. In this case, the drone is reconfigured to stop
acting as a WiFi hotspot and instead connect to the hotspot
mounted on the drone. The PubNub data stream library is
also installed on the drone, although in some modems it is
possible to install the data streaming service on the modem
itself [27]. On the ground, the controller can communicate
with the drone by using PubNub as well.
D. Short Message Service
SMS is designed for text messaging, which is in general
a delay tolerant application. The technology, however, has
also been used to control certain functions or to transmit
telemetry data from consumer-grade drones [5]. Using SMS
is a less popular alternative, nevertheless, it is possible to
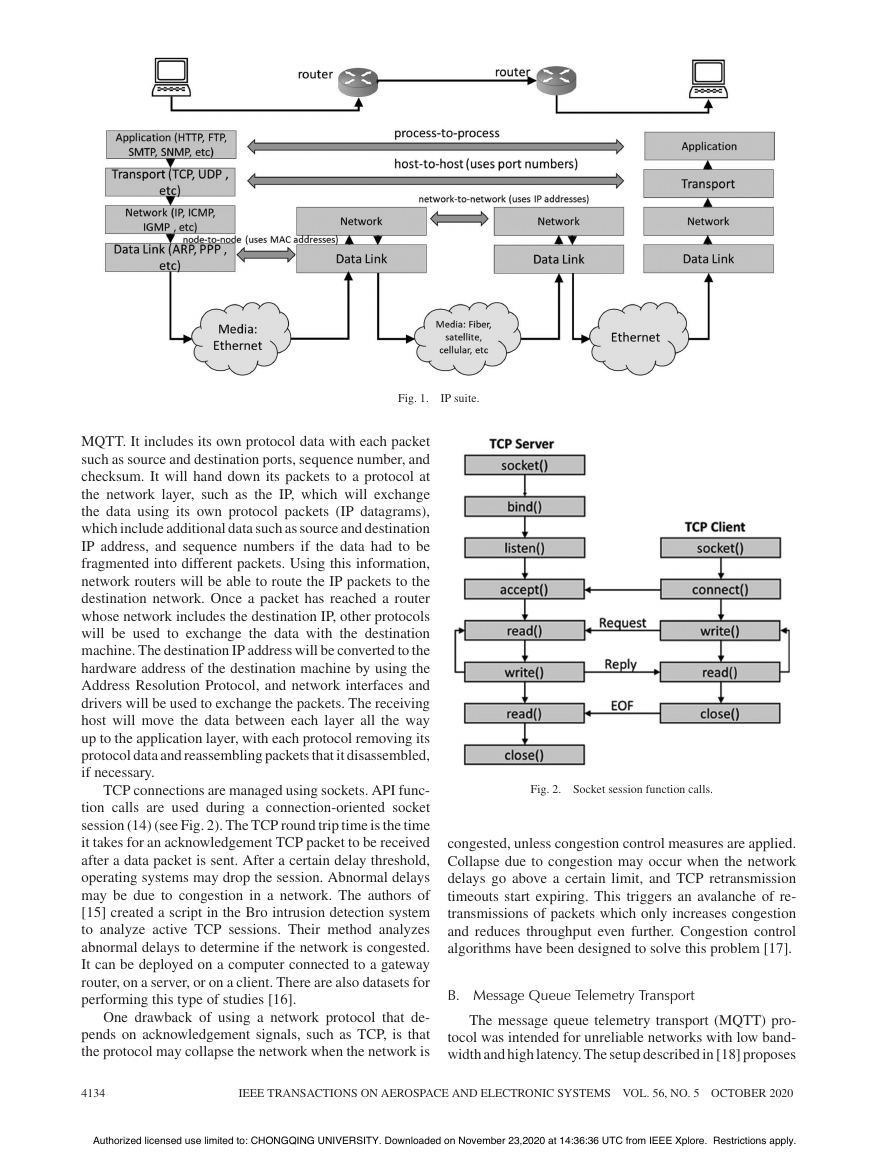
Fig. 3. Publish/subscribe pattern used in MQTT protocol.
using the Navio 2 hardware attached on top on top of a Rasp-
berry Pi with an Internet connection via WiFi or LTE. The
Navio 2 is hardware that includes sensors and controllers
that can be used to control six compatible consumer-grade
drone vehicles [19]. A preconfigured Raspberry OS image
may be installed on the Raspberry Pi computer that in-
cludes the ArduPilot and ROS open source software, which
are used to control the Navio 2. The system proposed in
[18] communicates with Amazon Web Services (AWS) via
MQTT. A serverless function transfers the MQTT data to
a database which is then analyzed by a machine learning
service to provide control capabilities.
MQTT is a popular choice for IoT applications, but it
has also been used in cell phone messaging applications.
Facebook Messenger [20], for example, is based on MQTT.
MQTT is a subscription-based protocol in which a server
acts as an intermediary (i.e., message broker server). Clients
subscribe to specific topics and the server delivers to them
only messages corresponding to those topics (see Fig. 3).
In general, subscribers can publish and receive messages
from different topics. Several devices can be subscribed to
a single topic. In a UAV system, for example, each topic
may be associated to one type of data, such as: command
data, telemetry data, and test data.
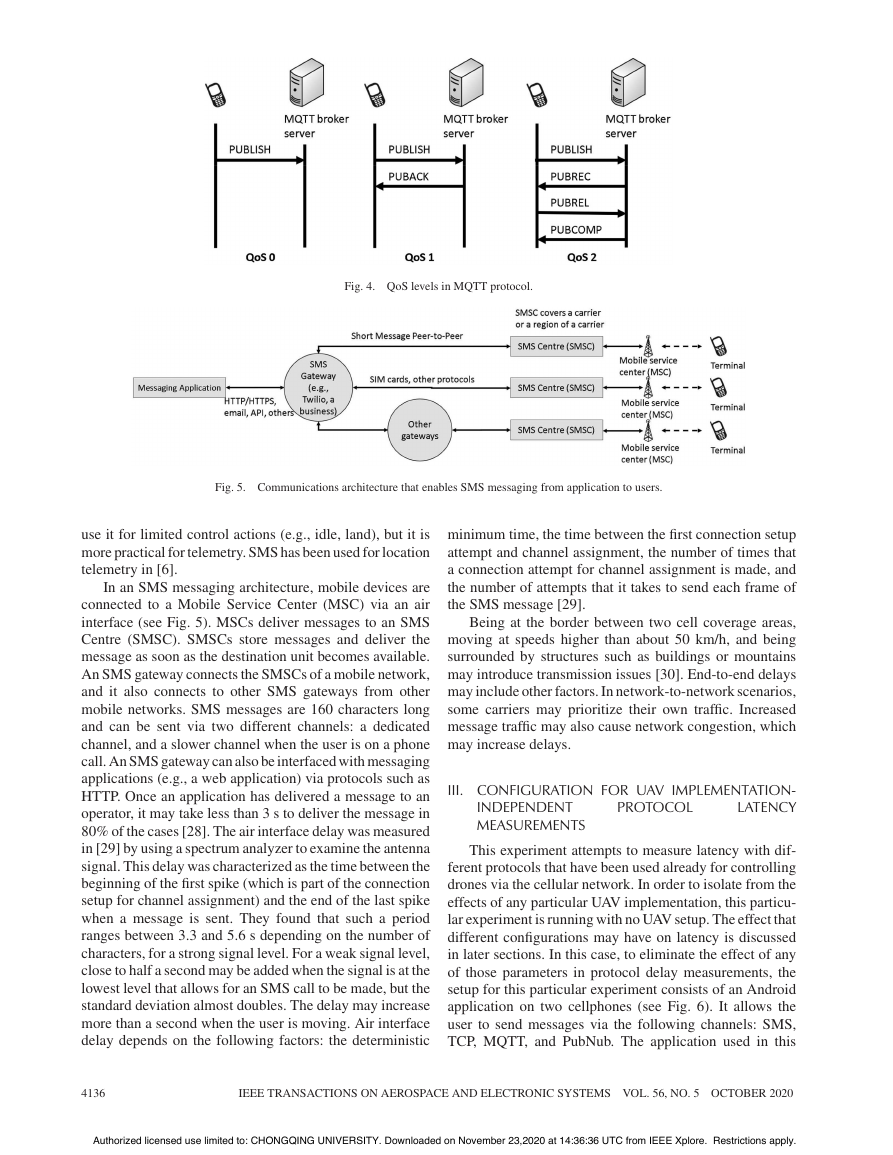
MQTT has 3 levels of quality of service (QoS) [8]
(see Fig. 4). At QoS Level 0 the sender will transmit the
message only once, and the receiver will not send back an
acknowledgment message. At QoS 1, the receiver will send
back an acknowledgment message. The sender expects an
acknowledgment message, and it will retransmit the mes-
sage until it gets it, but this also means that it can transmit the
message more than once. At QoS 2, a total of four protocol
messages are exchanged for every application message that
the sender wants to transmit. This ensures that the message
is received only once. Higher QoS level implies that less
messages will be lost, but it also increases the amount of
time required to exchange each message [21].
MQTT is generally implemented on top of the TCP/IP
(Internet Protocol) protocol stack. End-to-end delays for
MQTT communication were analyzed in [21] for messages
with different payload sizes. Packets were collected using
CORRESPONDENCE
4135
Authorized licensed use limited to: CHONGQING UNIVERSITY. Downloaded on November 23,2020 at 14:36:36 UTC from IEEE Xplore. Restrictions apply.
�
Fig. 4. QoS levels in MQTT protocol.
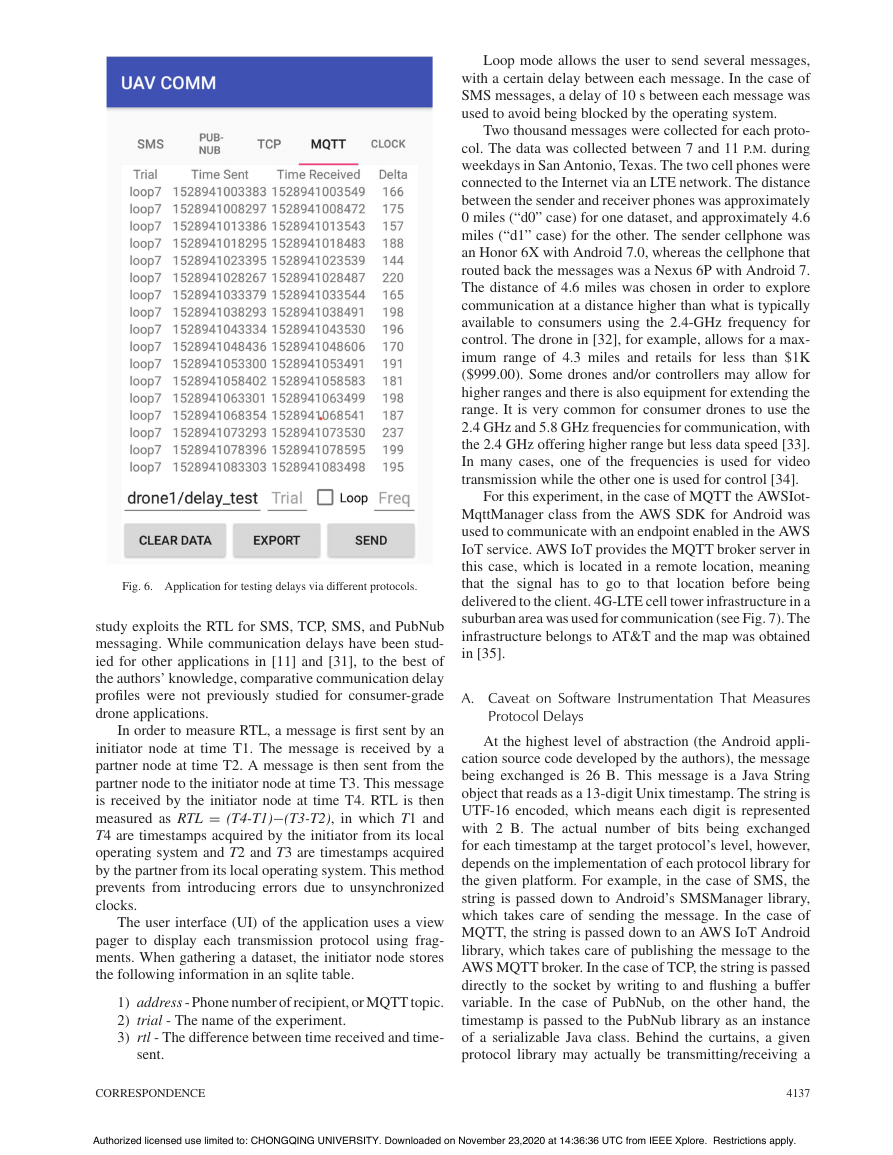
Fig. 5. Communications architecture that enables SMS messaging from application to users.
use it for limited control actions (e.g., idle, land), but it is
more practical for telemetry. SMS has been used for location
telemetry in [6].
In an SMS messaging architecture, mobile devices are
connected to a Mobile Service Center (MSC) via an air
interface (see Fig. 5). MSCs deliver messages to an SMS
Centre (SMSC). SMSCs store messages and deliver the
message as soon as the destination unit becomes available.
An SMS gateway connects the SMSCs of a mobile network,
and it also connects to other SMS gateways from other
mobile networks. SMS messages are 160 characters long
and can be sent via two different channels: a dedicated
channel, and a slower channel when the user is on a phone
call. An SMS gateway can also be interfaced with messaging
applications (e.g., a web application) via protocols such as
HTTP. Once an application has delivered a message to an
operator, it may take less than 3 s to deliver the message in
80% of the cases [28]. The air interface delay was measured
in [29] by using a spectrum analyzer to examine the antenna
signal. This delay was characterized as the time between the
beginning of the first spike (which is part of the connection
setup for channel assignment) and the end of the last spike
when a message is sent. They found that such a period
ranges between 3.3 and 5.6 s depending on the number of
characters, for a strong signal level. For a weak signal level,
close to half a second may be added when the signal is at the
lowest level that allows for an SMS call to be made, but the
standard deviation almost doubles. The delay may increase
more than a second when the user is moving. Air interface
delay depends on the following factors: the deterministic
minimum time, the time between the first connection setup
attempt and channel assignment, the number of times that
a connection attempt for channel assignment is made, and
the number of attempts that it takes to send each frame of
the SMS message [29].
Being at the border between two cell coverage areas,
moving at speeds higher than about 50 km/h, and being
surrounded by structures such as buildings or mountains
may introduce transmission issues [30]. End-to-end delays
may include other factors. In network-to-network scenarios,
some carriers may prioritize their own traffic. Increased
message traffic may also cause network congestion, which
may increase delays.
PROTOCOL
III. CONFIGURATION FOR UAV IMPLEMENTATION-
LATENCY
INDEPENDENT
MEASUREMENTS
This experiment attempts to measure latency with dif-
ferent protocols that have been used already for controlling
drones via the cellular network. In order to isolate from the
effects of any particular UAV implementation, this particu-
lar experiment is running with no UAV setup. The effect that
different configurations may have on latency is discussed
in later sections. In this case, to eliminate the effect of any
of those parameters in protocol delay measurements, the
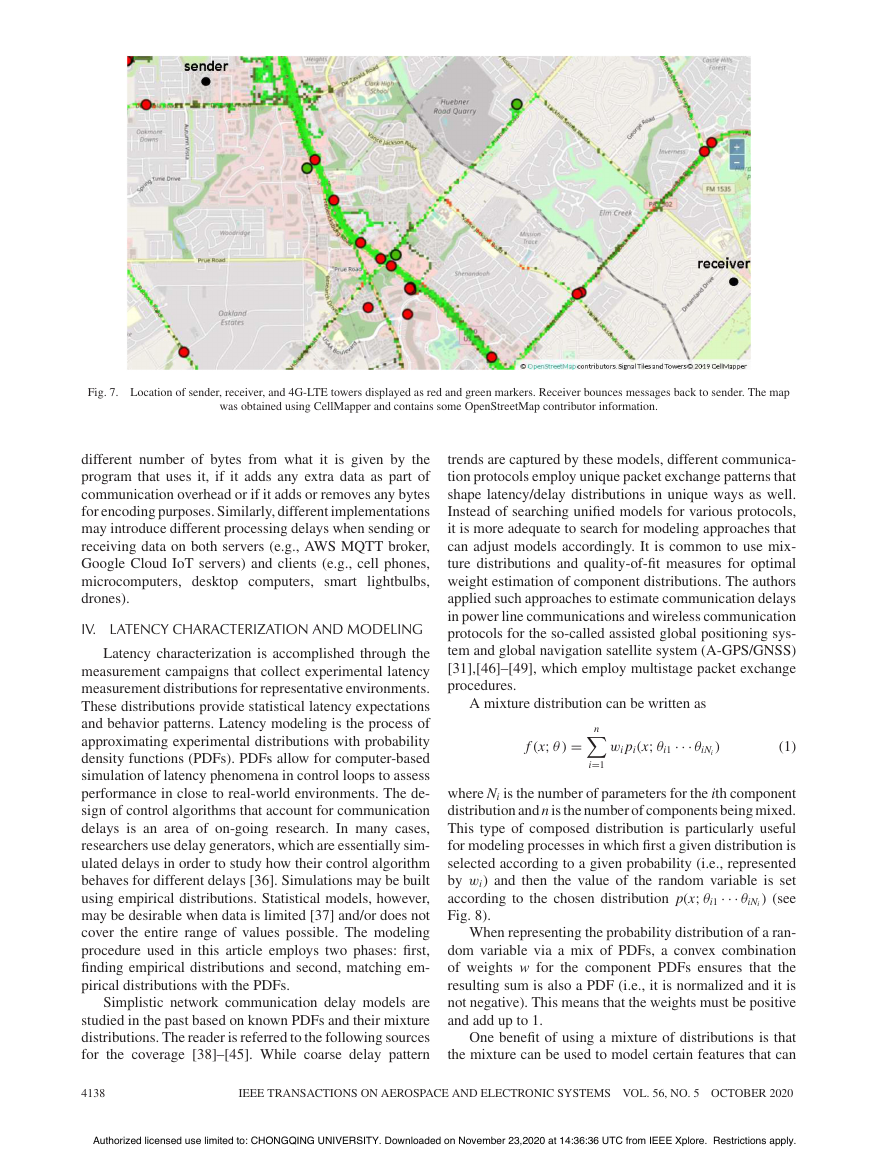
setup for this particular experiment consists of an Android
application on two cellphones (see Fig. 6). It allows the
user to send messages via the following channels: SMS,
TCP, MQTT, and PubNub. The application used in this
4136
IEEE TRANSACTIONS ON AEROSPACE AND ELECTRONIC SYSTEMS VOL. 56, NO. 5 OCTOBER 2020
Authorized licensed use limited to: CHONGQING UNIVERSITY. Downloaded on November 23,2020 at 14:36:36 UTC from IEEE Xplore. Restrictions apply.
�
Loop mode allows the user to send several messages,
with a certain delay between each message. In the case of
SMS messages, a delay of 10 s between each message was
used to avoid being blocked by the operating system.
Two thousand messages were collected for each proto-
col. The data was collected between 7 and 11 P.M. during
weekdays in San Antonio, Texas. The two cell phones were
connected to the Internet via an LTE network. The distance
between the sender and receiver phones was approximately
0 miles (“d0” case) for one dataset, and approximately 4.6
miles (“d1” case) for the other. The sender cellphone was
an Honor 6X with Android 7.0, whereas the cellphone that
routed back the messages was a Nexus 6P with Android 7.
The distance of 4.6 miles was chosen in order to explore
communication at a distance higher than what is typically
available to consumers using the 2.4-GHz frequency for
control. The drone in [32], for example, allows for a max-
imum range of 4.3 miles and retails for less than $1K
($999.00). Some drones and/or controllers may allow for
higher ranges and there is also equipment for extending the
range. It is very common for consumer drones to use the
2.4 GHz and 5.8 GHz frequencies for communication, with
the 2.4 GHz offering higher range but less data speed [33].
In many cases, one of the frequencies is used for video
transmission while the other one is used for control [34].
For this experiment, in the case of MQTT the AWSIot-
MqttManager class from the AWS SDK for Android was
used to communicate with an endpoint enabled in the AWS
IoT service. AWS IoT provides the MQTT broker server in
this case, which is located in a remote location, meaning
that the signal has to go to that location before being
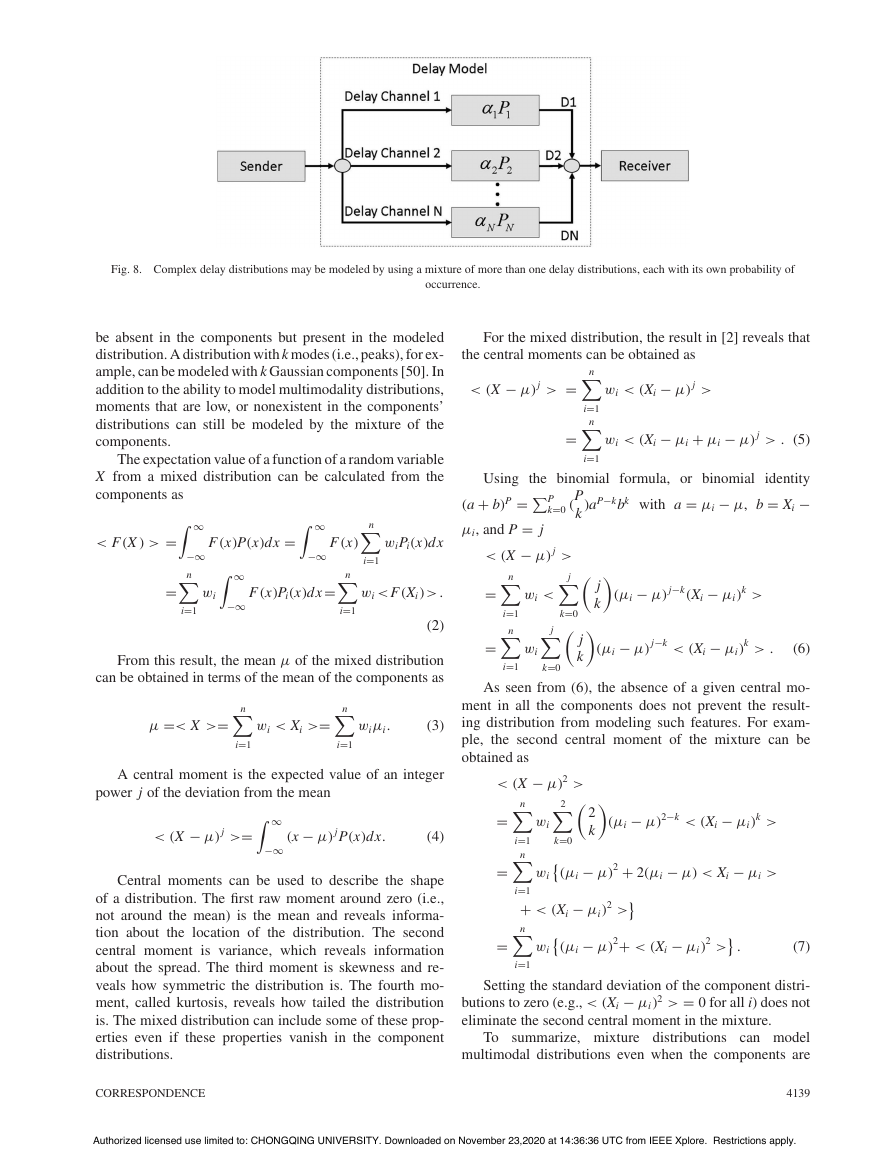
delivered to the client. 4G-LTE cell tower infrastructure in a
suburban area was used for communication (see Fig. 7). The
infrastructure belongs to AT&T and the map was obtained
in [35].
A. Caveat on Software Instrumentation That Measures
Protocol Delays
At the highest level of abstraction (the Android appli-
cation source code developed by the authors), the message
being exchanged is 26 B. This message is a Java String
object that reads as a 13-digit Unix timestamp. The string is
UTF-16 encoded, which means each digit is represented
with 2 B. The actual number of bits being exchanged
for each timestamp at the target protocol’s level, however,
depends on the implementation of each protocol library for
the given platform. For example, in the case of SMS, the
string is passed down to Android’s SMSManager library,
which takes care of sending the message. In the case of
MQTT, the string is passed down to an AWS IoT Android
library, which takes care of publishing the message to the
AWS MQTT broker. In the case of TCP, the string is passed
directly to the socket by writing to and flushing a buffer
variable. In the case of PubNub, on the other hand, the
timestamp is passed to the PubNub library as an instance
of a serializable Java class. Behind the curtains, a given
protocol library may actually be transmitting/receiving a
4137
Fig. 6. Application for testing delays via different protocols.
study exploits the RTL for SMS, TCP, SMS, and PubNub
messaging. While communication delays have been stud-
ied for other applications in [11] and [31], to the best of
the authors’ knowledge, comparative communication delay
profiles were not previously studied for consumer-grade
drone applications.
In order to measure RTL, a message is first sent by an
initiator node at time T1. The message is received by a
partner node at time T2. A message is then sent from the
partner node to the initiator node at time T3. This message
is received by the initiator node at time T4. RTL is then
measured as RTL = (T4-T1)−(T3-T2), in which T1 and
T4 are timestamps acquired by the initiator from its local
operating system and T2 and T3 are timestamps acquired
by the partner from its local operating system. This method
prevents from introducing errors due to unsynchronized
clocks.
The user interface (UI) of the application uses a view
pager to display each transmission protocol using frag-
ments. When gathering a dataset, the initiator node stores
the following information in an sqlite table.
1) address - Phone number of recipient, or MQTT topic.
2) trial - The name of the experiment.
3) rtl - The difference between time received and time-
sent.
CORRESPONDENCE
Authorized licensed use limited to: CHONGQING UNIVERSITY. Downloaded on November 23,2020 at 14:36:36 UTC from IEEE Xplore. Restrictions apply.
�
Fig. 7. Location of sender, receiver, and 4G-LTE towers displayed as red and green markers. Receiver bounces messages back to sender. The map
was obtained using CellMapper and contains some OpenStreetMap contributor information.
different number of bytes from what it is given by the
program that uses it, if it adds any extra data as part of
communication overhead or if it adds or removes any bytes
for encoding purposes. Similarly, different implementations
may introduce different processing delays when sending or
receiving data on both servers (e.g., AWS MQTT broker,
Google Cloud IoT servers) and clients (e.g., cell phones,
microcomputers, desktop computers, smart
lightbulbs,
drones).
IV. LATENCY CHARACTERIZATION AND MODELING
Latency characterization is accomplished through the
measurement campaigns that collect experimental latency
measurement distributions for representative environments.
These distributions provide statistical latency expectations
and behavior patterns. Latency modeling is the process of
approximating experimental distributions with probability
density functions (PDFs). PDFs allow for computer-based
simulation of latency phenomena in control loops to assess
performance in close to real-world environments. The de-
sign of control algorithms that account for communication
delays is an area of on-going research. In many cases,
researchers use delay generators, which are essentially sim-
ulated delays in order to study how their control algorithm
behaves for different delays [36]. Simulations may be built
using empirical distributions. Statistical models, however,
may be desirable when data is limited [37] and/or does not
cover the entire range of values possible. The modeling
procedure used in this article employs two phases: first,
finding empirical distributions and second, matching em-
pirical distributions with the PDFs.
Simplistic network communication delay models are
studied in the past based on known PDFs and their mixture
distributions. The reader is referred to the following sources
for the coverage [38]–[45]. While coarse delay pattern
trends are captured by these models, different communica-
tion protocols employ unique packet exchange patterns that
shape latency/delay distributions in unique ways as well.
Instead of searching unified models for various protocols,
it is more adequate to search for modeling approaches that
can adjust models accordingly. It is common to use mix-
ture distributions and quality-of-fit measures for optimal
weight estimation of component distributions. The authors
applied such approaches to estimate communication delays
in power line communications and wireless communication
protocols for the so-called assisted global positioning sys-
tem and global navigation satellite system (A-GPS/GNSS)
[31],[46]–[49], which employ multistage packet exchange
procedures.
A mixture distribution can be written as
wi pi(x; θi1 ··· θiNi )
f (x; θ ) = n
i=1
(1)
where Ni is the number of parameters for the ith component
distribution and n is the number of components being mixed.
This type of composed distribution is particularly useful
for modeling processes in which first a given distribution is
selected according to a given probability (i.e., represented
by wi) and then the value of the random variable is set
according to the chosen distribution p(x; θi1 ··· θiNi ) (see
Fig. 8).
When representing the probability distribution of a ran-
dom variable via a mix of PDFs, a convex combination
of weights w for the component PDFs ensures that the
resulting sum is also a PDF (i.e., it is normalized and it is
not negative). This means that the weights must be positive
and add up to 1.
One benefit of using a mixture of distributions is that
the mixture can be used to model certain features that can
4138
IEEE TRANSACTIONS ON AEROSPACE AND ELECTRONIC SYSTEMS VOL. 56, NO. 5 OCTOBER 2020
Authorized licensed use limited to: CHONGQING UNIVERSITY. Downloaded on November 23,2020 at 14:36:36 UTC from IEEE Xplore. Restrictions apply.
�
Fig. 8. Complex delay distributions may be modeled by using a mixture of more than one delay distributions, each with its own probability of
occurrence.
be absent in the components but present in the modeled
distribution. A distribution with k modes (i.e., peaks), for ex-
ample, can be modeled with k Gaussian components [50]. In
addition to the ability to model multimodality distributions,
moments that are low, or nonexistent in the components’
distributions can still be modeled by the mixture of the
components.
The expectation value of a function of a random variable
X from a mixed distribution can be calculated from the
components as
∞
= n
−∞
i=1
∞
n
F (x)P(x)dx =
∞
−∞
F (x)Pi(x)dx= n
F (x)
wi
−∞
i=1
wiPi(x)dx
i=1
wi < F (Xi) > .
(2)
< F (X ) > =
From this result, the mean μ of the mixed distribution
can be obtained in terms of the mean of the components as
μ =< X >= n
wi < Xi >= n
i=1
wiμi.
(3)
i=1
A central moment is the expected value of an integer
power j of the deviation from the mean
< (X − μ) j >=
(x − μ) jP(x)dx.
(4)
∞
−∞
Central moments can be used to describe the shape
of a distribution. The first raw moment around zero (i.e.,
not around the mean) is the mean and reveals informa-
tion about the location of the distribution. The second
central moment is variance, which reveals information
about the spread. The third moment is skewness and re-
veals how symmetric the distribution is. The fourth mo-
ment, called kurtosis, reveals how tailed the distribution
is. The mixed distribution can include some of these prop-
erties even if these properties vanish in the component
distributions.
For the mixed distribution, the result in [2] reveals that
the central moments can be obtained as
Using the binomial formula, or binomial
< (X − μ) j > = n
= n
i=1
i=1
P
k
P
k=0 (
(a + b)P =
μi, and P = j
= n
= n
< (X − μ) j >
j
j
wi <
k=0
i=1
wi
j
k
i=1
k=0
wi < (Xi − μ) j >
wi < (Xi − μi + μi − μ) j > . (5)
identity
)aP−kbk with a = μi − μ, b = Xi −
(μi − μ) j−k(Xi − μi)k >
j
k
(μi − μ) j−k < (Xi − μi)k > .
(6)
As seen from (6), the absence of a given central mo-
ment in all the components does not prevent the result-
ing distribution from modeling such features. For exam-
ple, the second central moment of the mixture can be
obtained as
wi
2
k
i=1
< (X − μ)2 >
2
= n
= n
i=1
+ < (Xi − μi)2 >
= n
wi
wi
i=1
(μi − μ)2−k < (Xi − μi)k >
k=0
(μi − μ)2 + 2(μi − μ) < Xi − μi >
(μi − μ)2+ < (Xi − μi)2 >
.
(7)
Setting the standard deviation of the component distri-
butions to zero (e.g., < (Xi − μi)2 > = 0 for all i) does not
eliminate the second central moment in the mixture.
To summarize, mixture distributions can model
multimodal distributions even when the components are
CORRESPONDENCE
4139
Authorized licensed use limited to: CHONGQING UNIVERSITY. Downloaded on November 23,2020 at 14:36:36 UTC from IEEE Xplore. Restrictions apply.
�


 2023年江西萍乡中考道德与法治真题及答案.doc
 2012年重庆南川中考生物真题及答案.doc
 2013年江西师范大学地理学综合及文艺理论基础考研真题.doc
 2020年四川甘孜小升初语文真题及答案I卷.doc
 2020年注册岩土工程师专业基础考试真题及答案.doc
 2023-2024学年福建省厦门市九年级上学期数学月考试题及答案.doc
 2021-2022学年辽宁省沈阳市大东区九年级上学期语文期末试题及答案.doc
 2022-2023学年北京东城区初三第一学期物理期末试卷及答案.doc
 2018上半年江西教师资格初中地理学科知识与教学能力真题及答案.doc
 2012年河北国家公务员申论考试真题及答案-省级.doc
 2020-2021学年江苏省扬州市江都区邵樊片九年级上学期数学第一次质量检测试题及答案.doc
 2022下半年黑龙江教师资格证中学综合素质真题及答案.doc