Agricultural Sciences, 2018, 9, 910-923
http://www.scirp.org/journal/as
ISSN Online: 2156-8561
ISSN Print: 2156-8553
Application of Decision Support System for
Agro Technology Transfer (DSSAT) to Simulate
Agronomic Practices for Cultivation of Maize in
Southern Highland of Tanzania
Lusajo Henry Mfwango*, Sangharsh Kumar Tripathi, Gogumalla Pranuthi,
Sunil Kumar Dubey, Vijay Kumar Gubey
Department of Water Resources and Irrigation Engineering, Water Institute, Dar es Salaam, Tanzania
How to cite this paper: Mfwango, L.H.,
Tripathi, S.K., Pranuthi, G., Dubey, S.K.
and Gubey, V.K. (2018) Application of
Decision Support System for Agro Tech-
nology Transfer (DSSAT)
to Simulate
Agronomic Practices for Cultivation of
Maize in Southern Highland of Tanzania.
Agricultural Sciences, 9, 910-923.
https://doi.org/10.4236/as.2018.97063
Received: June 26, 2018
Accepted: July 27, 2018
Published: July 30, 2018
Copyright © 2018 by authors and
Scientific Research Publishing Inc.
This work is licensed under the Creative
Commons Attribution International
License (CC BY 4.0).
http://creativecommons.org/licenses/by/4.0/
Open Access
Abstract
The southern highlands zone of Tanzania is the one of the most potential area
for agriculture contributes up to 46% of the total country’s maize production.
However, the rate of maize production tends to decrease with time due of
poor agronomic practices. The aim of this study was to simulate the effect of
nitrogen dose and plant spacing on grain yields from five selected maize va-
rieties. Decision Support System for Agrotechnology transfer crop model was
used for this purpose. Based on the agroecological zones, six sites were se-
lected which includes Ihumbu farm, Mwazye and Nyera Estate Mbozi, Lupa
Tinga Tinga, Santilya and Mbinga. Maize varieties H614, Kitumani Compo-
site I, H511, H626 and H612; Spacing (90 × 30 cm and 60 × 30 cm) and ni-
trogen dose (0, 50, 100, 150 and 200 kg/ha) were simulated. It was found that
only H614 (4610.9 kg/ha) and Kitumani Composite I (3998.7 kg/ha) maize
varieties performed well at the spacing of 60 × 30 cm and up to the nitrogen
dose of 150 kg/ha. Therefore the two maize varieties H614 and Kitumani
Composite I could be recommended for cultivation at the spacing of 60 × 30
cm and nitrogen dose of 150 kg/ha for improving production of maize in
southern highland of Tanzania.
Keywords
Southern Highlands (Tanzania), DSSAT, Nitrogen Dose, Plant Spacing and
Maize Varieties
1. Introduction
The economy of Tanzania is highly dependent on agriculture which provides the
DOI: 10.4236/as.2018.97063 Jul. 30, 2018
910
Agricultural Sciences
�
L. H. Mfwango et al.
source of livelihood for over 80% of the population. The agricultural sector con-
stitutes nearly 24% of the value of the national income (GDP) [1]. To a large ex-
tent the sector is characterized by traditional production systems which rely on
indigenous varieties whose overall productivity is generally low.
The southern highlands zone of Tanzania contributes about 46% of national
maize production and it accounts for nearly 90% of the maize purchased for the
National Food Security Granary [2]. This zone comprises of four regions viz.
Iringa, Mbeya, Rukwa, and Ruvuma. Over 80% of the maize produced in this re-
gion is grown by smallholders under a wide range of agronomic practices, cli-
matic conditions, and socioeconomic conditions. Beside the contribution of the
zone to the country maize production, still there is a large gap between national
average yield (1.4 t/ha) and potential yields (7.0 t/ha) [3]. Among the agronomic
factors responsible for low yield of the region which are plant population in the
field, application of inappropriate amount of inorganic fertilizers and use of low
yielding varieties/cultivars are of prime importance [4]. Crop row spacing is
another important agronomic management strategy used by farmers to optimize
the husbandry of the soil and plant ecosystem from sowing to harvest with the
goal of increasing the production of crops [5]. Row spacing has a special signi-
ficance since it is ultimately related with plant population, root development,
plant growth and fruiting [6]. Maize is well known for its high demand of nu-
trients. In addition to other agronomic practices, fertilization may be the most
important way to maintain high crop productivity and soil fertility [7]. The fact
that nitrogen has a good effect on plant productivity is universally accepted.
Nevertheless, it also has a pollutant effect on the environment when dissolved
and leach down to ground water/aquifer zones when applied irrationally. When
nitrogen is rapidly leached down to ground water, they affect human and animal
health [8]. Therefore, judicious use of mineral nitrogen fertilizer should be pro-
moted on improvement maize productivity [9], without reduction in yields and
much adverse impact on environment (soil and ground water quality). The de-
velopment of appropriate management practices can be achieved by employing
crop models like DSSAT in simulation studies.
The decision support system for agro technology transfer (DSSAT) crop mod-
el has been used for different applications in various countries around the world.
It was originally developed by an international network of scientists, cooperating
in the International Benchmark Sites Network for Agrotechnology Transfer
project [10], to facilitate the application of crop system models such as Crop En-
vironment Resource Synthesis (CERES) maize model in a systems approach to
agronomic research. Its initial development was motivated by a need to integrate
knowledge about soil, climate, crops, and management for making better deci-
sions about transferring production technology from one location to others
where soils and climate differed [11]. The DSSAT helps decision-makers by re-
ducing the time and human resources required for analyzing complex alternative
decisions [12]. It also provides a framework for scientific cooperation through
911
Agricultural Sciences
DOI: 10.4236/as.2018.97063
�
L. H. Mfwango et al.
research to integrate new knowledge and apply it to research questions. The ob-
jective of this study is to simulate the effect of nitrogen dose, spacing and suita-
bility of varieties on increasing grain yield of maize grown in southern highland
zone of Tanzania by application of CERES-maize model of DSSAT.
2. Materials and Methods
2.1. Description of the Study Area
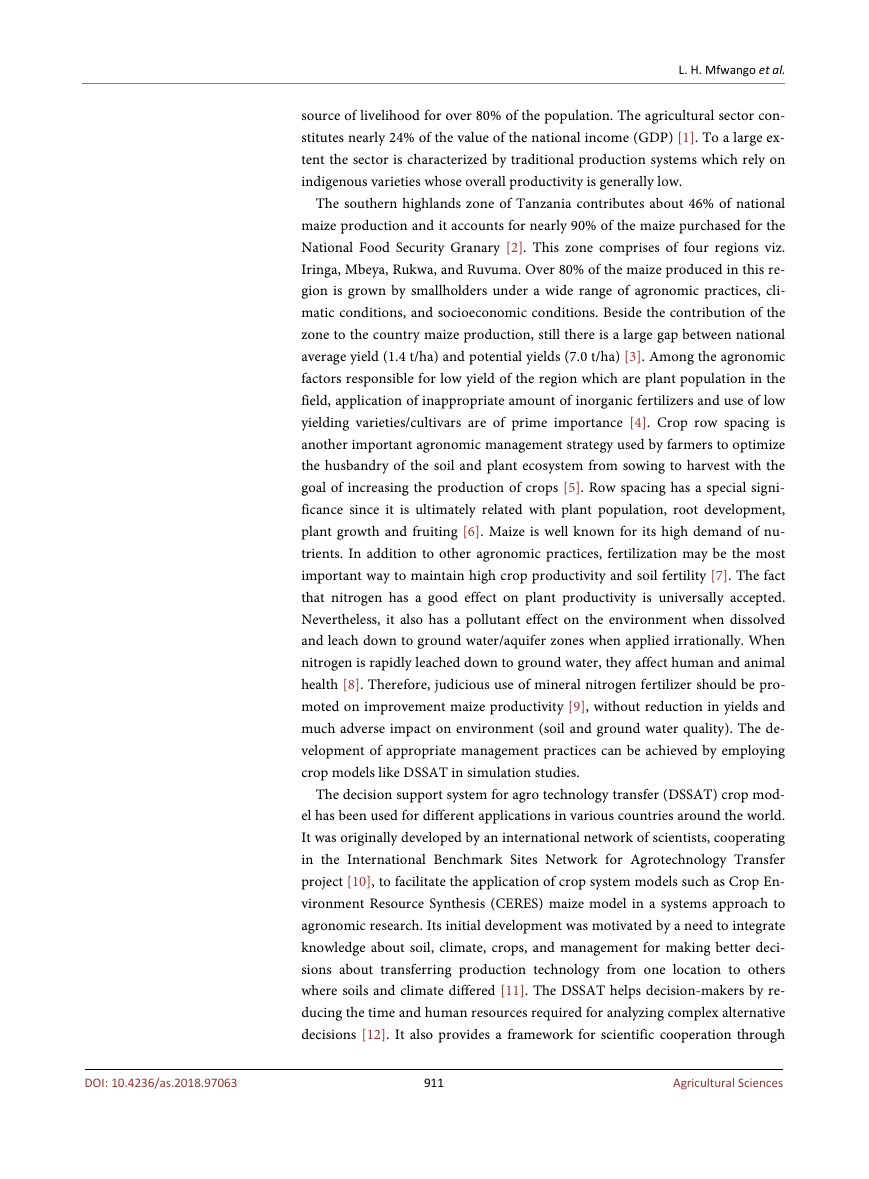
The southern highlands zone found on the latitude of 7˚ and 11.5˚S and longi-
tudes of 30˚ and 38˚E (Figure 1). The zone occupies an area of 250,000 km2
which is about 28% of the mainland area of Tanzania. The elevation from the sea
level ranges from 400 and 3000 m. The region experience semi-arid condition in
some parts of Iringa region to high rainfall in highland areas (more than 2500
mm of rain per year) with cool temperatures. The rainfall pattern is unimodal
with a long rainy season (700 mm to over 2600 mm) from November to May
with a dry and cool spell between June and September [13]. The soil has low fer-
tility, highly weathered and frequently acidic. Normally, maize is planted be-
tween the ends of November and early of December and harvested between
April and July, depending on the weather and the variety grown [14]. For the
purposes of the study six (6) sites were bee selected, Ihumbu farm (−7.88, 35.8),
Mwazye (−8.43, 31.71), Nyera Estate Mbozi (−9.16, 33.11), Santilya (−9.08, 33),
Lupa Tinga Tinga (−8.01, 33.26) and Mbinga (−10.91, 35.0).
2.2. Model Input Data
DSSAT crop simulation models in generally predict crop yield as a function of
DOI: 10.4236/as.2018.97063
Figure 1. Map of Tanzania showing the location of Southern Highland zone.
912
Agricultural Sciences
�
L. H. Mfwango et al.
weather conditions, soil conditions and crop management practices. The mini-
mum daily weather data required running the DSSAT models which includes
maximum and minimum temperature (˚C), rainfall (mm), and sunshine hours
(hours/day) which were downloaded from the New_LocClim of Food and Agri-
culture Organisation. The New_locClim (an abbreviation for “Local Climate”), a
software program and database, provides estimates of average climatic condi-
tions at locations for which no observations are available. The sunshine hours
(hours/day) were converted into solar radiation (MJm−2 day−1) by using Wea-
therman tool of DSSAT.
Soil characteristics data which includes clay fraction (%), silt fraction (%),
stones fraction (%), organic carbon (%), CEC (Cation Exchange Capacity)
(cmol/kg), pH (in water), horizon thickness (depth), surface characteristics such
as soil color, Land slope, permeability, drainage class, and soil series name.
These data were obtained from HWSD (Harmonized World Soil Database)
which was created by the Food and Agriculture Organization of the United Na-
tions and the International Institute for Applied Systems Analysis (IIASA) [15].
These organizations took the initiative of combining the recently collected vast
volumes of regional and national updates of soil information with the informa-
tion already contained within the 1:5,000,000 scales FAO-UNESCO Digital Soil
Map of the World, into a new comprehensive HWSD.
The crop management data were obtained from the survey report, docu-
mented by [14]. These data includes crop cultivar, planting date, seedling rate
(plant/hill), plant spacing (cm), row spacing (cm), and planting depth (cm).
Others include fertilizer application (dates, amounts, type of material, and me-
thod of application), tillage/intercultural operations (dates, depth equipment
used), organic fertilizer amendments (date, amount, type and method of appli-
cation). The collected soil and weather data were for running the model were
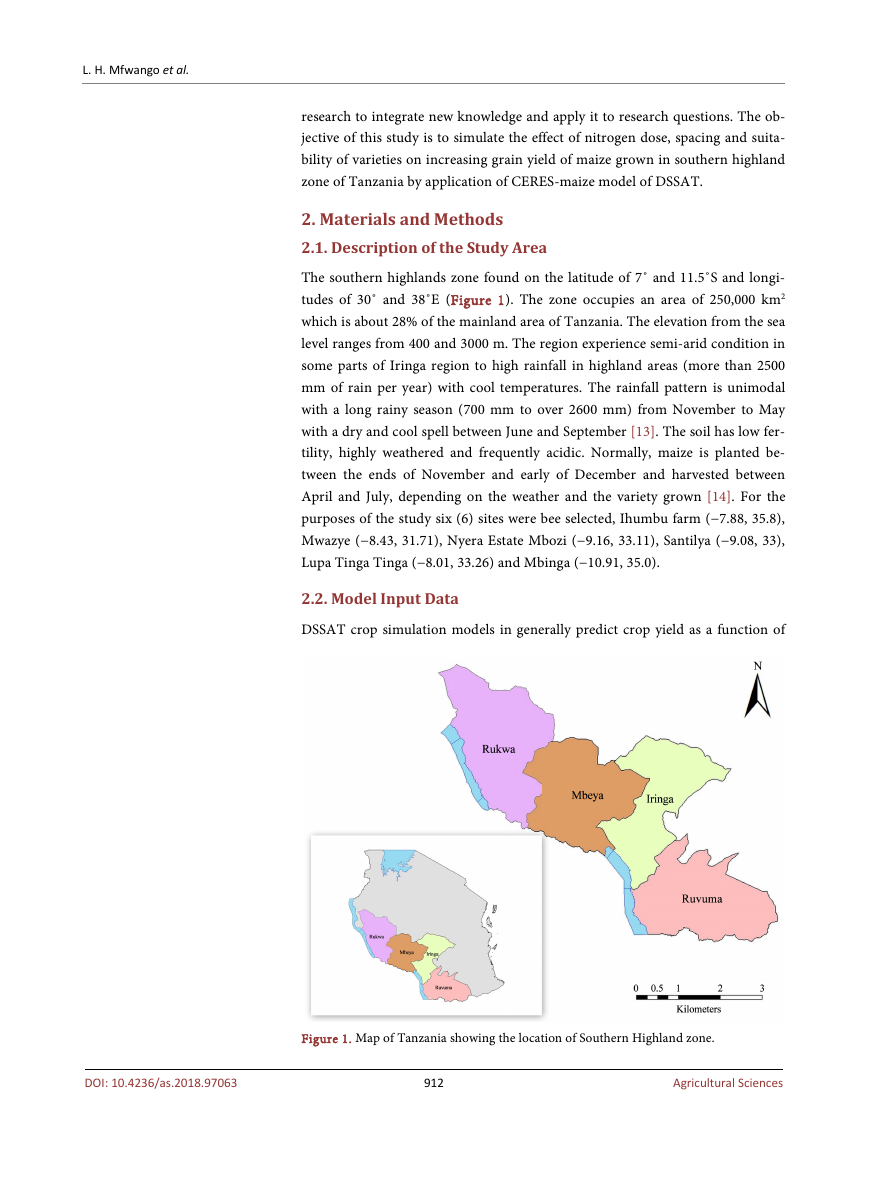
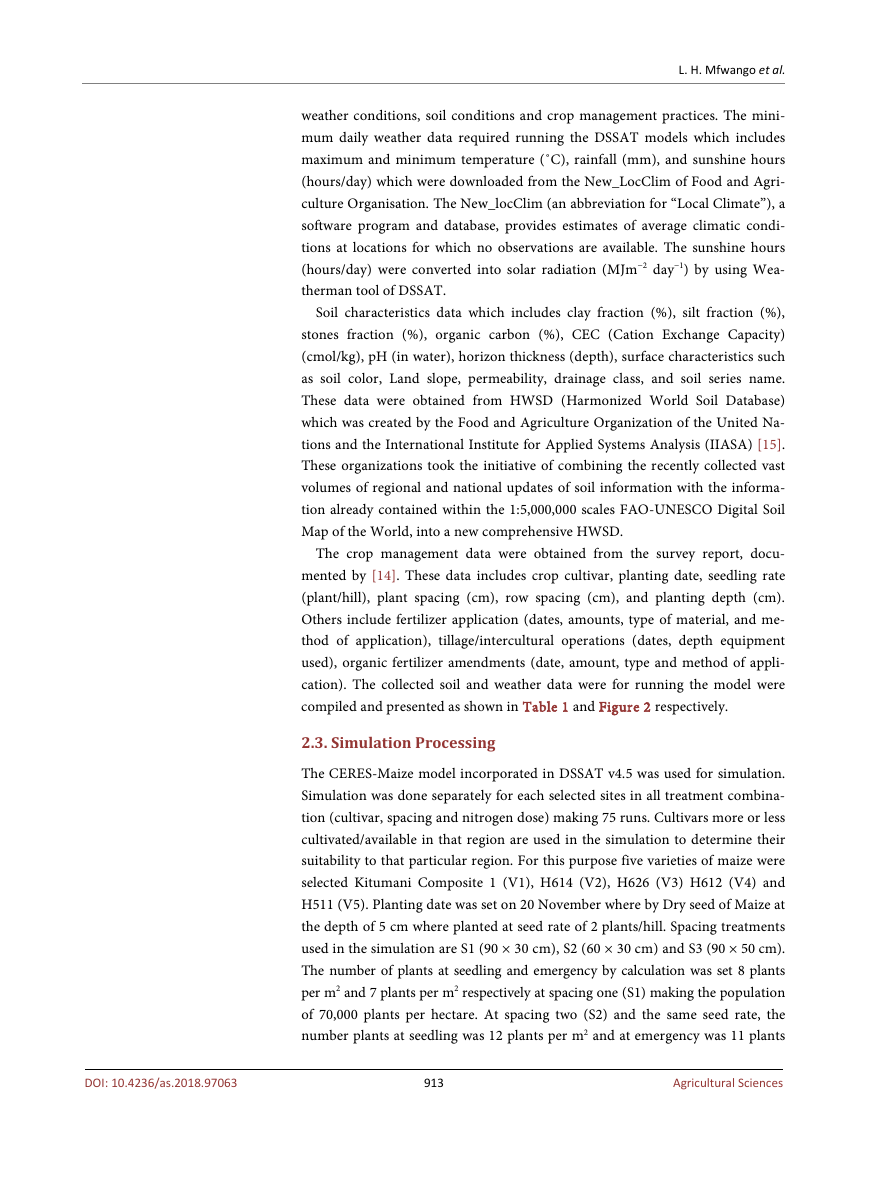
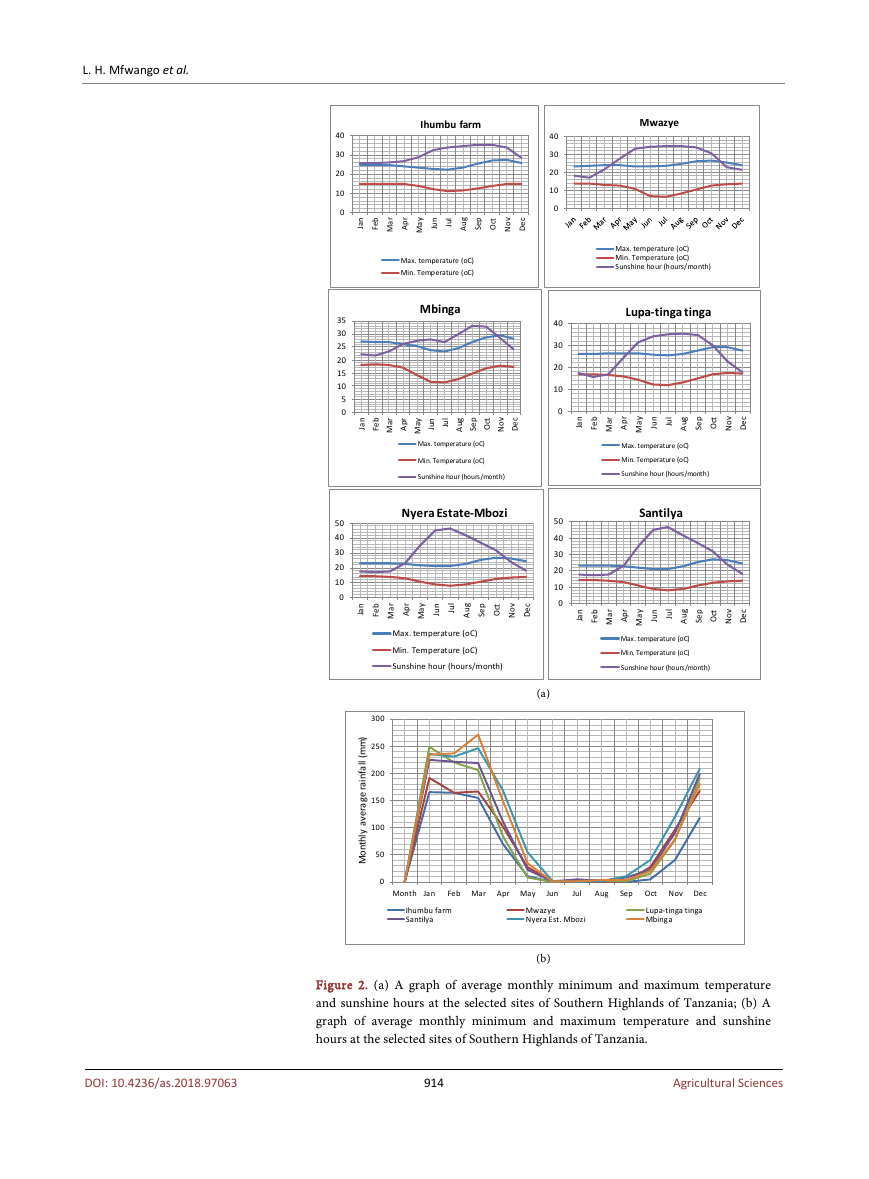
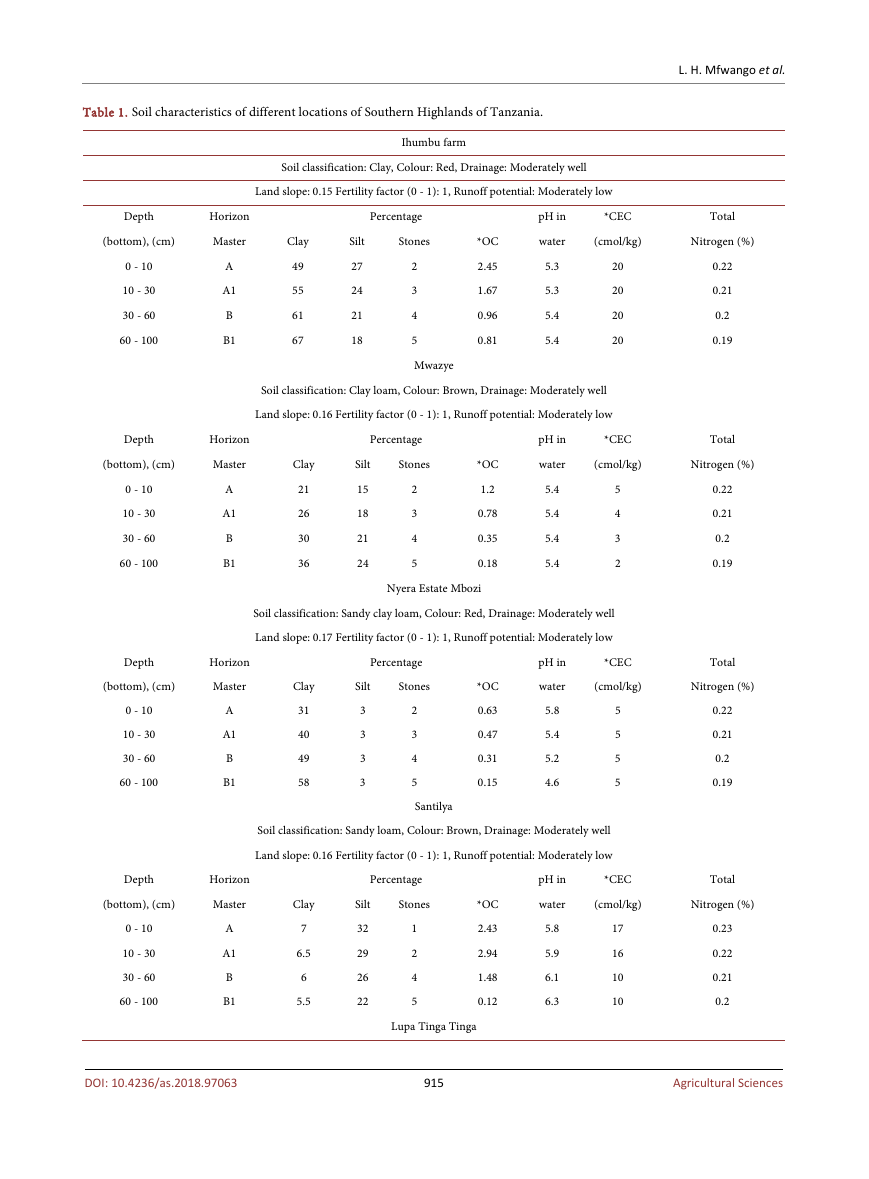
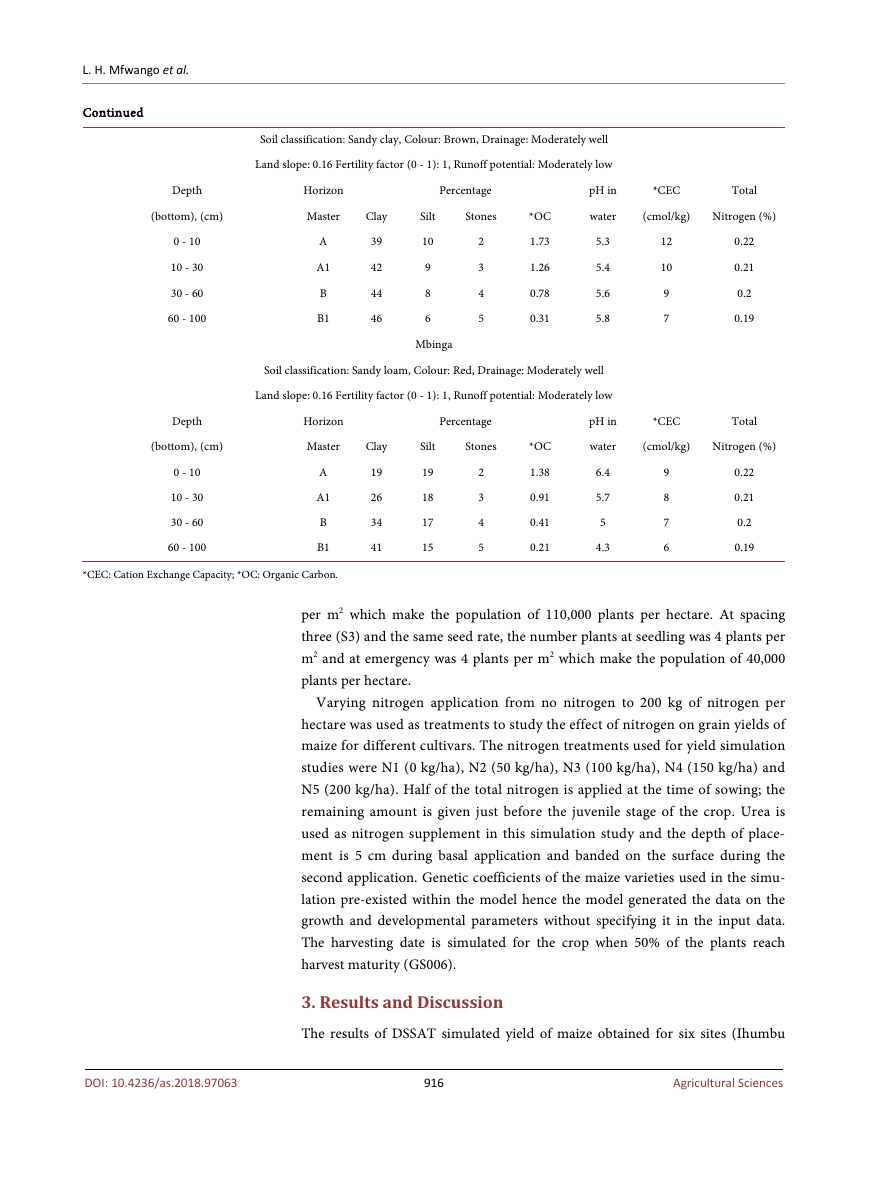
compiled and presented as shown in Table 1 and Figure 2 respectively.
2.3. Simulation Processing
The CERES-Maize model incorporated in DSSAT v4.5 was used for simulation.
Simulation was done separately for each selected sites in all treatment combina-
tion (cultivar, spacing and nitrogen dose) making 75 runs. Cultivars more or less
cultivated/available in that region are used in the simulation to determine their
suitability to that particular region. For this purpose five varieties of maize were
selected Kitumani Composite 1 (V1), H614 (V2), H626 (V3) H612 (V4) and
H511 (V5). Planting date was set on 20 November where by Dry seed of Maize at
the depth of 5 cm where planted at seed rate of 2 plants/hill. Spacing treatments
used in the simulation are S1 (90 × 30 cm), S2 (60 × 30 cm) and S3 (90 × 50 cm).
The number of plants at seedling and emergency by calculation was set 8 plants
per m2 and 7 plants per m2 respectively at spacing one (S1) making the population
of 70,000 plants per hectare. At spacing two (S2) and the same seed rate, the
number plants at seedling was 12 plants per m2 and at emergency was 11 plants
913
Agricultural Sciences
DOI: 10.4236/as.2018.97063
�
L. H. Mfwango et al.
Mwazye
40
30
20
10
0
40
30
20
10
0
50
40
30
20
10
0
Max. temperature (oC)
Min. Temperature (oC)
Sunshine hour (hours/month)
Lupa-tinga tinga
n
a
J
b
e
F
r
a
M
r
p
A
y
a
M
n
u
J
l
u
J
g
u
A
p
e
S
t
c
O
v
o
N
c
e
D
Max. temperature (oC)
Min. Temperature (oC)
Sunshine hour (hours/month)
Santilya
n
a
J
b
e
F
r
a
M
r
p
A
y
a
M
n
u
J
l
u
J
g
u
A
p
e
S
t
c
O
v
o
N
c
e
D
Max. temperature (oC)
Min. Temperature (oC)
Sunshine hour (hours/month)
(a)
40
30
20
10
0
35
30
25
20
15
10
5
0
50
40
30
20
10
0
Ihumbu farm
n
a
J
b
e
F
r
a
M
r
p
A
y
a
M
n
u
J
l
u
J
g
u
A
p
e
S
t
c
O
v
o
N
c
e
D
Max. temperature (oC)
Min. Temperature (oC)
Mbinga
n
a
J
b
e
F
r
a
M
r
p
A
y
a
M
n
u
J
l
u
J
g
u
A
p
e
S
t
c
O
v
o
N
c
e
D
Max. temperature (oC)
Min. Temperature (oC)
Sunshine hour (hours/month)
Nyera Estate-Mbozi
n
a
J
b
e
F
r
a
M
r
p
A
y
a
M
n
u
J
l
u
J
g
u
A
p
e
S
t
c
O
v
o
N
c
e
D
Max. temperature (oC)
Min. Temperature (oC)
Sunshine hour (hours/month)
)
m
m
(
l
l
a
f
n
i
a
r
e
g
a
r
e
v
a
y
l
h
t
n
o
M
300
250
200
150
100
50
0
Month Jan
Feb Mar
Apr May
Jun
Jul
Aug
Sep
Oct
Nov
Dec
Ihumbu farm
Santilya
Mwazye
Nyera Est. Mbozi
Lupa-tinga tinga
Mbinga
(b)
Figure 2. (a) A graph of average monthly minimum and maximum temperature
and sunshine hours at the selected sites of Southern Highlands of Tanzania; (b) A
graph of average monthly minimum and maximum temperature and sunshine
hours at the selected sites of Southern Highlands of Tanzania.
914
Agricultural Sciences
DOI: 10.4236/as.2018.97063
�
L. H. Mfwango et al.
Table 1. Soil characteristics of different locations of Southern Highlands of Tanzania.
Ihumbu farm
Soil classification: Clay, Colour: Red, Drainage: Moderately well
Land slope: 0.15 Fertility factor (0 - 1): 1, Runoff potential: Moderately low
Depth
(bottom), (cm)
Horizon
Master
Percentage
Clay
Silt
Stones
0 - 10
10 - 30
30 - 60
60 - 100
A
A1
B
B1
49
55
61
67
27
24
21
18
2
3
4
5
Mwazye
pH in
water
5.3
5.3
5.4
5.4
*OC
2.45
1.67
0.96
0.81
*CEC
Total
(cmol/kg)
Nitrogen (%)
20
20
20
20
0.22
0.21
0.2
0.19
Soil classification: Clay loam, Colour: Brown, Drainage: Moderately well
Land slope: 0.16 Fertility factor (0 - 1): 1, Runoff potential: Moderately low
Depth
(bottom), (cm)
Horizon
Master
Percentage
Clay
Silt
Stones
0 - 10
10 - 30
30 - 60
60 - 100
A
A1
B
B1
21
26
30
36
15
18
21
24
2
3
4
5
pH in
water
5.4
5.4
5.4
5.4
*OC
1.2
0.78
0.35
0.18
*CEC
Total
(cmol/kg)
Nitrogen (%)
5
4
3
2
0.22
0.21
0.2
0.19
Nyera Estate Mbozi
Soil classification: Sandy clay loam, Colour: Red, Drainage: Moderately well
Land slope: 0.17 Fertility factor (0 - 1): 1, Runoff potential: Moderately low
Depth
(bottom), (cm)
Horizon
Master
0 - 10
10 - 30
30 - 60
60 - 100
A
A1
B
B1
Clay
31
40
49
58
Silt
3
3
3
3
Percentage
Stones
2
3
4
5
Santilya
pH in
water
5.8
5.4
5.2
4.6
*OC
0.63
0.47
0.31
0.15
*CEC
(cmol/kg)
Total
Nitrogen (%)
5
5
5
5
0.22
0.21
0.2
0.19
Soil classification: Sandy loam, Colour: Brown, Drainage: Moderately well
Land slope: 0.16 Fertility factor (0 - 1): 1, Runoff potential: Moderately low
Depth
(bottom), (cm)
Horizon
Master
Percentage
Clay
Silt
Stones
0 - 10
10 - 30
30 - 60
60 - 100
A
A1
B
B1
7
6.5
6
5.5
32
29
26
22
1
2
4
5
pH in
water
5.8
5.9
6.1
6.3
*OC
2.43
2.94
1.48
0.12
*CEC
Total
(cmol/kg)
Nitrogen (%)
17
16
10
10
0.23
0.22
0.21
0.2
Lupa Tinga Tinga
DOI: 10.4236/as.2018.97063
915
Agricultural Sciences
�
L. H. Mfwango et al.
Continued
Soil classification: Sandy clay, Colour: Brown, Drainage: Moderately well
Land slope: 0.16 Fertility factor (0 - 1): 1, Runoff potential: Moderately low
Depth
Horizon
(bottom), (cm)
Master
Clay
0 - 10
10 - 30
30 - 60
60 - 100
A
A1
B
B1
39
42
44
46
Percentage
Stones
2
3
4
5
Silt
10
9
8
6
Mbinga
pH in
water
5.3
5.4
5.6
5.8
*CEC
Total
(cmol/kg)
Nitrogen (%)
12
10
9
7
0.22
0.21
0.2
0.19
*OC
1.73
1.26
0.78
0.31
Soil classification: Sandy loam, Colour: Red, Drainage: Moderately well
Land slope: 0.16 Fertility factor (0 - 1): 1, Runoff potential: Moderately low
Depth
Horizon
Percentage
(bottom), (cm)
Master
Clay
Silt
Stones
0 - 10
10 - 30
30 - 60
60 - 100
A
A1
B
B1
19
26
34
41
19
18
17
15
2
3
4
5
pH in
water
6.4
5.7
5
4.3
*OC
1.38
0.91
0.41
0.21
*CEC
Total
(cmol/kg)
Nitrogen (%)
9
8
7
6
0.22
0.21
0.2
0.19
*CEC: Cation Exchange Capacity; *OC: Organic Carbon.
per m2 which make the population of 110,000 plants per hectare. At spacing
three (S3) and the same seed rate, the number plants at seedling was 4 plants per
m2 and at emergency was 4 plants per m2 which make the population of 40,000
plants per hectare.
Varying nitrogen application from no nitrogen to 200 kg of nitrogen per
hectare was used as treatments to study the effect of nitrogen on grain yields of
maize for different cultivars. The nitrogen treatments used for yield simulation
studies were N1 (0 kg/ha), N2 (50 kg/ha), N3 (100 kg/ha), N4 (150 kg/ha) and
N5 (200 kg/ha). Half of the total nitrogen is applied at the time of sowing; the
remaining amount is given just before the juvenile stage of the crop. Urea is
used as nitrogen supplement in this simulation study and the depth of place-
ment is 5 cm during basal application and banded on the surface during the
second application. Genetic coefficients of the maize varieties used in the simu-
lation pre-existed within the model hence the model generated the data on the
growth and developmental parameters without specifying it in the input data.
The harvesting date is simulated for the crop when 50% of the plants reach
harvest maturity (GS006).
3. Results and Discussion
The results of DSSAT simulated yield of maize obtained for six sites (Ihumbu
916
Agricultural Sciences
DOI: 10.4236/as.2018.97063
�
L. H. Mfwango et al.
farm, Mwazye and Nyera Estate Mbozi, Lupa Tinga Tinga, Santilya and Mbin-
ga), five varieties (H614, Kitumani Composite I, H511, H626 and H612), five ni-
trogen doses (0, 50, 100, 150 and 200 kg N/ha) and three spacings (90 × 30 cm,
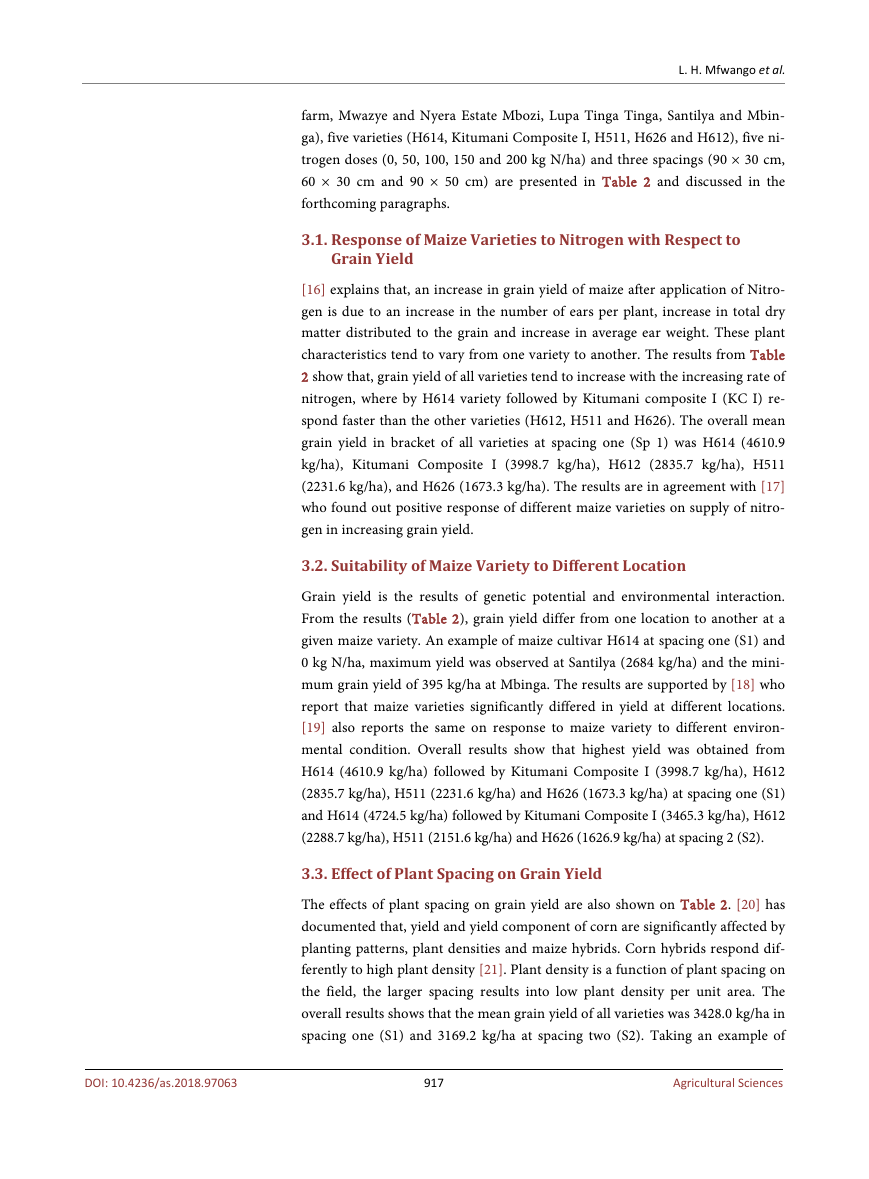
60 × 30 cm and 90 × 50 cm) are presented in Table 2 and discussed in the
forthcoming paragraphs.
3.1. Response of Maize Varieties to Nitrogen with Respect to
Grain Yield
[16] explains that, an increase in grain yield of maize after application of Nitro-
gen is due to an increase in the number of ears per plant, increase in total dry
matter distributed to the grain and increase in average ear weight. These plant
characteristics tend to vary from one variety to another. The results from Table
2 show that, grain yield of all varieties tend to increase with the increasing rate of
nitrogen, where by H614 variety followed by Kitumani composite I (KC I) re-
spond faster than the other varieties (H612, H511 and H626). The overall mean
grain yield in bracket of all varieties at spacing one (Sp 1) was H614 (4610.9
kg/ha), Kitumani Composite I (3998.7 kg/ha), H612 (2835.7 kg/ha), H511
(2231.6 kg/ha), and H626 (1673.3 kg/ha). The results are in agreement with [17]
who found out positive response of different maize varieties on supply of nitro-
gen in increasing grain yield.
3.2. Suitability of Maize Variety to Different Location
Grain yield is the results of genetic potential and environmental interaction.
From the results (Table 2), grain yield differ from one location to another at a
given maize variety. An example of maize cultivar H614 at spacing one (S1) and
0 kg N/ha, maximum yield was observed at Santilya (2684 kg/ha) and the mini-
mum grain yield of 395 kg/ha at Mbinga. The results are supported by [18] who
report that maize varieties significantly differed in yield at different locations.
[19] also reports the same on response to maize variety to different environ-
mental condition. Overall results show that highest yield was obtained from
H614 (4610.9 kg/ha) followed by Kitumani Composite I (3998.7 kg/ha), H612
(2835.7 kg/ha), H511 (2231.6 kg/ha) and H626 (1673.3 kg/ha) at spacing one (S1)
and H614 (4724.5 kg/ha) followed by Kitumani Composite I (3465.3 kg/ha), H612
(2288.7 kg/ha), H511 (2151.6 kg/ha) and H626 (1626.9 kg/ha) at spacing 2 (S2).
3.3. Effect of Plant Spacing on Grain Yield
The effects of plant spacing on grain yield are also shown on Table 2. [20] has
documented that, yield and yield component of corn are significantly affected by
planting patterns, plant densities and maize hybrids. Corn hybrids respond dif-
ferently to high plant density [21]. Plant density is a function of plant spacing on
the field, the larger spacing results into low plant density per unit area. The
overall results shows that the mean grain yield of all varieties was 3428.0 kg/ha in
spacing one (S1) and 3169.2 kg/ha at spacing two (S2). Taking an example of
917
Agricultural Sciences
DOI: 10.4236/as.2018.97063
�


 2023年江西萍乡中考道德与法治真题及答案.doc
 2012年重庆南川中考生物真题及答案.doc
 2013年江西师范大学地理学综合及文艺理论基础考研真题.doc
 2020年四川甘孜小升初语文真题及答案I卷.doc
 2020年注册岩土工程师专业基础考试真题及答案.doc
 2023-2024学年福建省厦门市九年级上学期数学月考试题及答案.doc
 2021-2022学年辽宁省沈阳市大东区九年级上学期语文期末试题及答案.doc
 2022-2023学年北京东城区初三第一学期物理期末试卷及答案.doc
 2018上半年江西教师资格初中地理学科知识与教学能力真题及答案.doc
 2012年河北国家公务员申论考试真题及答案-省级.doc
 2020-2021学年江苏省扬州市江都区邵樊片九年级上学期数学第一次质量检测试题及答案.doc
 2022下半年黑龙江教师资格证中学综合素质真题及答案.doc