CRC STANDARD PROBABILITY AND STATISTICS TABLES AND FORMULAE
Preface
Acknowlegments
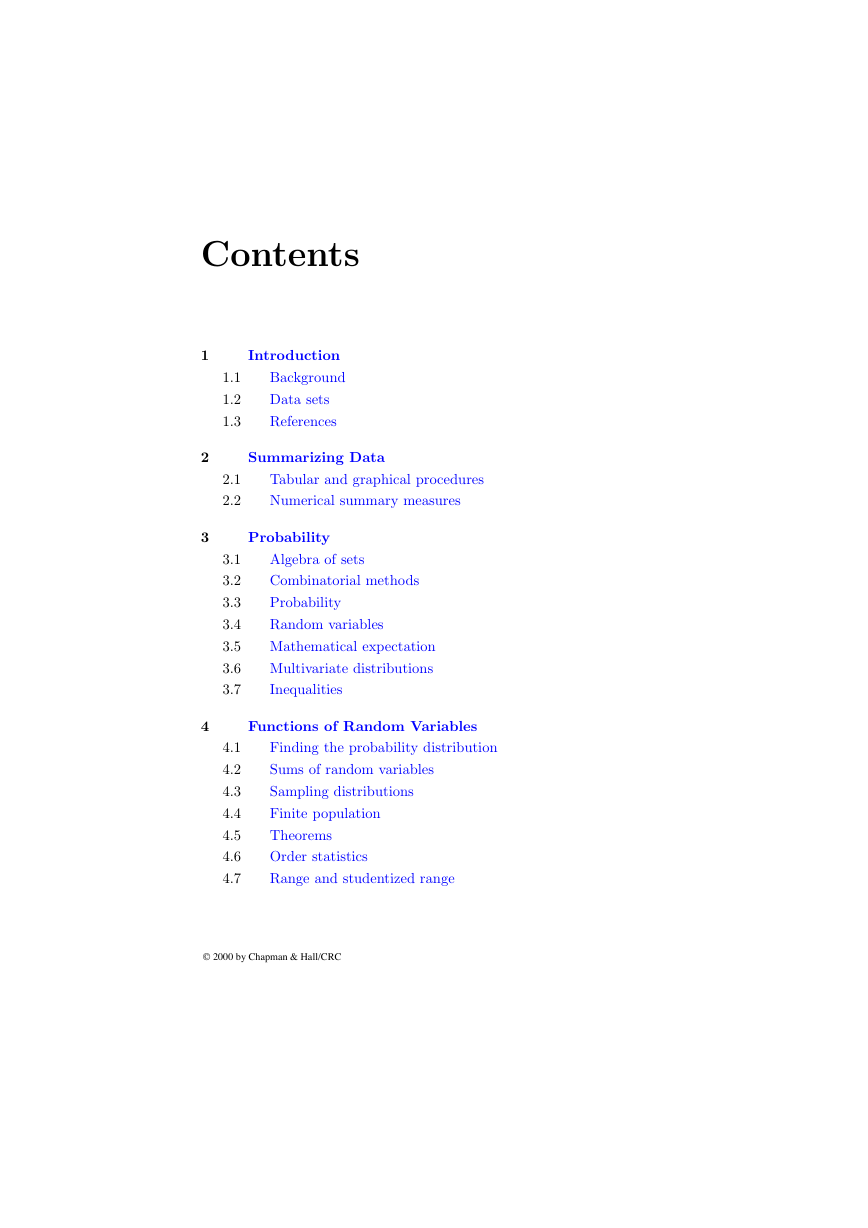
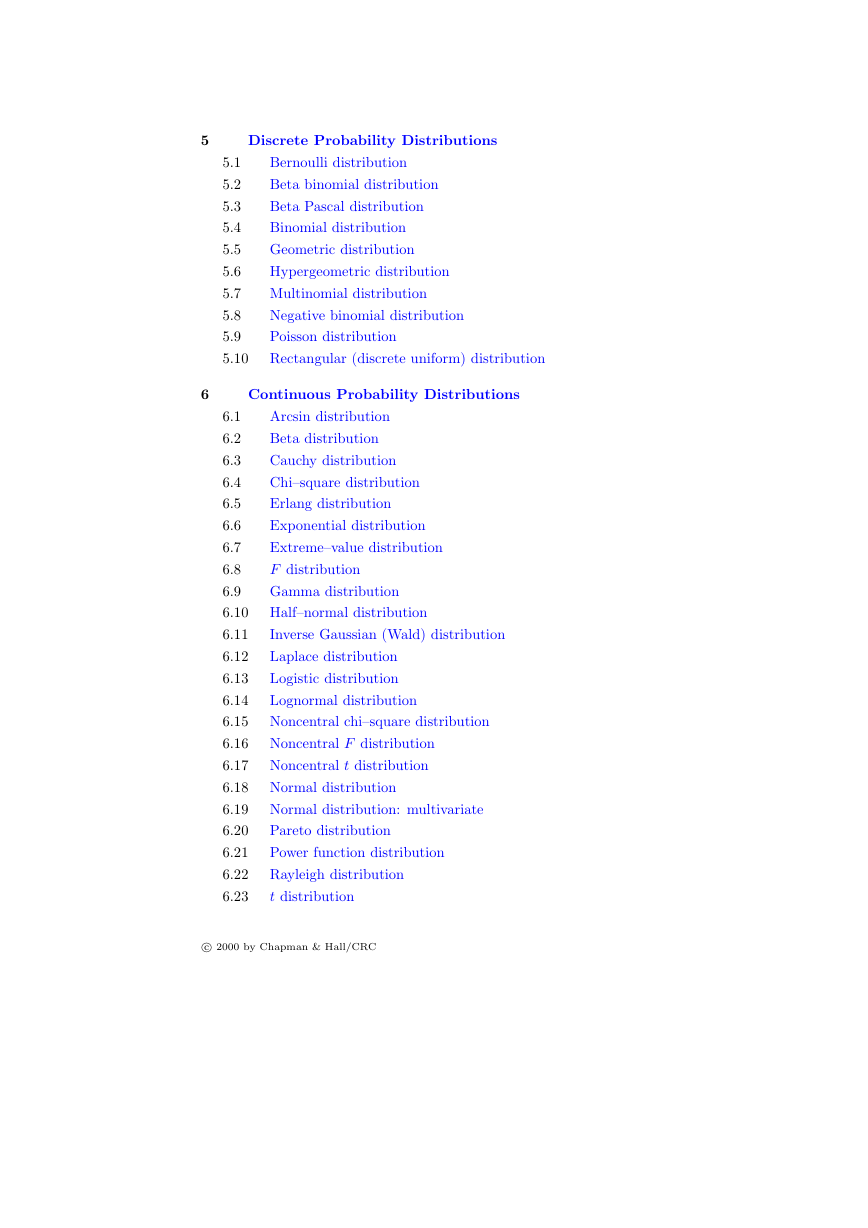
Contents
1889_pdf_c01.pdf
CRC STANDARD PROBABILITY AND STATISTICS TABLES AND FORMULAE
Table of Contents
CHAPTER 1: Introduction
1.1 BACKGROUND
1.2 DATA SETS
1.3 REFERENCES
1889_pdf_c02.pdf
CRC STANDARD PROBABILITY AND STATISTICS TABLES AND FORMULAE
Table of Contents
CHAPTER 2: Summarizing Data
2.1 TABULAR AND GRAPHICAL PROCEDURES
2.1.1 Stem-and-leaf plot
2.1.2 Frequency distribution
2.1.3 Histogram
2.1.4 Frequency polygons
2.1.5 Chernoff faces
2.2 NUMERICAL SUMMARY MEASURES
2.2.1 (Arithmetic) mean
2.2.2 Weighted (arithmetic) mean
2.2.3 Geometric mean
2.2.4 Harmonic mean
2.2.5 Mode
2.2.6 Median
2.2.7 p % trimmed mean
2.2.8 Quartiles
2.2.9 Deciles
2.2.10 Percentiles
2.2.11 Mean deviation
2.2.12 Variance
2.2.13 Standard deviation
2.2.14 Standard errors
2.2.14.1 Standard error of the mean
2.2.15 Root mean square
2.2.16 Range
2.2.17 Interquartile range
2.2.18 Quartile deviation
2.2.19 Box plots
2.2.20 Coefficient of variation
2.2.21 Coefficient of quartile variation
2.2.22 Z score
2.2.23 Moments
2.2.24 Measures of skewness
2.2.24.1 Coefficient of skewness
2.2.24.2 Coefficient of momental skewness
2.2.24.3 Pearson’s first coefficient of skewness
2.2.24.4 Pearson’s second moment of skewness
2.2.24.5 Quartile coefficient of skewness
2.2.25 Measures of kurtosis
2.2.25.1 Coefficient of kurtosis
2.2.25.2 Coefficient of excess kurtosis
2.2.26 Data transformations
2.2.27 Sheppard’s corrections for grouping
1889_pdf_c03.pdf
CRC STANDARD PROBABILITY AND STATISTICS TABLES AND FORMULAE
Table of Contents
CHAPTER 3: Probability
3.1 ALGEBRA OF SETS
3.2 COMBINATORIAL METHODS
3.2.1 The product rule for ordered pairs
3.2.2 The generalized product rule for k-tuples
3.2.3 Permutations
3.2.4 Circular permutations
3.2.5 Combinations (binomial coefficients)
3.2.6 Sample selection
3.2.7 Balls into cells
3.2.8 Multinomial coefficients
3.2.9 Arrangements and derangements
3.3 PROBABILITY
3.3.1 Relative frequency concept of probability
3.3.2 Axioms of probability (discrete sample space)
3.3.3 The probability of an event
3.3.4 Probability theorems
3.3.5 Probability and odds
3.3.6 Conditional probability
3.3.7 The multiplication rule
3.3.8 The law of total probability
3.3.9 Bayes’ theorem
3.3.10 Independence
3.4 RANDOM VARIABLES
3.4.1 Discrete random variables
3.4.1.1 Probability mass function
3.4.1.2 Cumulative distribution function
3.4.2 Continuous random variables
3.4.2.1 Probability density function
3.4.2.2 Cumulative distribution function
3.4.3 Random functions
3.5 MATHEMATICAL EXPECTATION
3.5.1 Expected value
3.5.2 Variance
3.5.2.1 Theorems
3.5.3 Moments
3.5.3.1 Moments about the origin
3.5.3.2 Moments about the mean
3.5.3.3 Factorial moments
3.5.4 Generating functions
3.5.4.1 Moment generating function
3.5.4.2 Factorial moment generating functions
3.5.4.3 Factorial moment generating function theorems
3.5.4.4 Cumulant generating function
3.5.4.5 Characteristic function
3.6 MULTIVARIATE DISTRIBUTIONS
3.6.1 Discrete case
3.6.2 Continuous case
3.6.3 Expectation
3.6.4 Moments
3.6.5 Marginal distributions
3.6.6 Independent random variables
3.6.7 Conditional distributions
3.6.8 Variance and covariance
3.6.9 Correlation coefficient
3.6.10 Moment generating function
3.6.11 Linear combination of random variables
3.6.12 Bivariate distribution
3.6.12.1 Joint probability distribution
3.6.12.2 Cumulative distribution function
3.6.12.4 Conditional distributions
3.6.12.5 Conditional expectation
3.7 INEQUALITIES
1889_pdf_c04.pdf
CRC STANDARD PROBABILITY AND STATISTICS TABLES AND FORMULAE
Table of Contents
CHAPTER 4: Functions of Random Variables
4.1 FINDING THE PROBABILITY DISTRIBUTION
4.1.1 Method of distribution functions
4.1.2 Method of transformations (one variable)
4.1.3 Method of transformations (two or more variables)
4.1.4 Method of moment generating functions
4.2 SUMS OF RANDOM VARIABLES
4.2.1 Deterministic sums of random variables
4.2.2 Random sums of random variables
4.3 SAMPLING DISTRIBUTIONS
4.3.1 Definitions
4.3.2 The sample mean
4.3.3 Central limit theorem
4.3.4 The law of large numbers
4.3.5 Laws of the iterated logarithm
4.4 FINITE POPULATION
4.5 THEOREMS
4.5.1 Theorems: the chi–square distribution
4.5.2 Theorems: the t distribution
4.5.3 Theorems: the F distribution
4.6 ORDER STATISTICS
4.6.1 Definition
4.6.2 The first order statistic
4.6.3 The nth order statistic
4.6.4 The median
4.6.5 Joint distributions
4.6.6 Midrange and range
4.6.7 Uniform distribution: order statistics
4.6.7.1 Tolerance intervals
4.6.8 Normal distribution: order statistics
4.6.8.1 Expected value of normal order statistics
4.6.8.2 Variances and covariances of order statistics
4.7 RANGE AND STUDENTIZED RANGE
4.7.1 Probability integral of the range
4.7.2 Percentage points, studentized range
1889_pdf_c05.pdf
CRC STANDARD PROBABILITY AND STATISTICS TABLES AND FORMULAE
Table of Contents
CHAPTER 5: Discrete Probability Distributions
5.1 BERNOULLI DISTRIBUTION
5.1.1 Properties
5.1.2 Variates
5.2 BETA BINOMIAL DISTRIBUTION
5.2.1 Properties
5.2.2 Variates
5.3 BETA PASCAL DISTRIBUTION
5.3.1 Properties
5.4 BINOMIAL DISTRIBUTION
5.4.1 Properties
5.4.2 Variates
5.4.3 Tables
5.5 GEOMETRIC DISTRIBUTION
5.5.1 Properties
5.5.2 Variates
5.5.3 Tables
5.6 HYPERGEOMETRIC DISTRIBUTION
5.6.1 Properties
5.6.2 Variates
5.6.3 Tables
5.7 MULTINOMIAL DISTRIBUTION
5.7.1 Properties
5.7.2 Variates
5.8 NEGATIVE BINOMIAL DISTRIBUTION
5.8.1 Properties
5.8.1.1 Alternative characterization
5.8.2 Variates
5.8.3 Tables
5.9 POISSON DISTRIBUTION
5.9.1 Properties
5.9.2 Variates
5.9.3 Tables
5.10 RECTANGULAR (DISCRETE UNIFORM) DISTRIBUTION
5.10.1 Properties
1889_pdf_c06.pdf
CRC STANDARD PROBABILITY AND STATISTICS TABLES AND FORMULAE
Table of Contents
CHAPTER 6: Continuous Probability Distributions
6.1 ARCSIN DISTRIBUTION
6.1.1 Properties
6.1.2 Probability density function
6.2 BETA DISTRIBUTION
6.2.1 Properties
6.2.2 Probability density function
6.2.3 Related distributions
6.3 CAUCHY DISTRIBUTION
6.3.1 Properties
6.3.2 Probability density function
6.3.3 Related distributions
6.4 CHI–SQUARE DISTRIBUTION
6.4.1 Properties
6.4.2 Probability density function
6.4.3 Related distributions
6.4.4 Critical values for chi–square distribution
6.4.5 Percentage points, chi–square over degrees of freedom distribution
6.5 ERLANG DISTRIBUTION
6.5.1 Properties
6.5.2 Probability density function
6.5.3 Related distributions
6.6 EXPONENTIAL DISTRIBUTION
6.6.1 Properties
6.6.2 Probability density function
6.6.3 Related distributions
6.7 EXTREME–VALUE DISTRIBUTION
6.7.1 Properties
6.7.2 Probability density function
6.7.3 Related distributions
6.8 F DISTRIBUTION
6.8.1 Properties
6.8.2 Probability density function
6.8.3 Related distributions
6.8.4 Critical values for the F distribution
6.9 GAMMA DISTRIBUTION
6.9.1 Properties
6.9.2 Probability density function
6.9.3 Related distributions
6.10 HALF –NORMAL DISTRIBUTION
6.10.1 Properties
6.10.2 Probability density function
6.11 INVERSE GAUSSIAN (WALD) DISTRIBUTION
6.11.1 Properties
6.11.2 Probability density function
6.11.3 Related distributions
6.12 LAPLACE DISTRIBUTION
6.12.1 Properties
6.12.2 Probability density function
6.12.3 Related distributions
6.13 LOGISTIC DISTRIBUTION
6.13.1 Properties
6.13.2 Probability density function
6.13.3 Related distributions
6.14 LOGNORMAL DISTRIBUTION
6.14.1 Properties
6.14.2 Probability density function
6.14.3 Related distributions
6.15 NONCENTRAL CHI –SQUARE DISTRIBUTION
6.15.1 Properties
6.15.2 Probability density function
6.15.3 Related distributions
6.16 NONCENTRAL F DISTRIBUTION
6.16.1 Properties
6.16.2 Probability density function
6.16.3 Related distributions
6.17 NONCENTRAL t DISTRIBUTION
6.17.1 Properties
6.17.2 Probability density function
6.17.3 Related distributions
6.18 NORMAL DISTRIBUTION
6.18.1 Properties
6.18.2 Probability density function
6.18.3 Related distributions
6.19 NORMAL DISTRIBUTION: MULTIVARIATE
6.19.1 Properties
6.19.2 Probability density function
6.20 PARETO DISTRIBUTION
6.20.1 Properties
6.20.2 Probability density function
6.20.3 Related distributions
6.21 POWER FUNCTION DISTRIBUTION
6.21.1 Properties
6.21.2 Probability density function
6.21.3 Related distributions
6.22 RAYLEIGH DISTRIBUTION
6.22.1 Properties
6.22.2 Probability density function
6.22.3 Related distributions
6.23 t DISTRIBUTION
6.23.1 Properties
6.23.2 Probability density function
6.23.3 Related distributions
6.23.4 Critical values for the t distribution
6.24 TRIANGULAR DISTRIBUTION
6.24.1 Properties
6.24.2 Probability density function
6.25 UNIFORM DISTRIBUTION
6.25.1 Properties
6.25.2 Probability density function
6.25.3 Related distributions
6.26 WEIBULL DISTRIBUTION
6.26.1 Properties
6.26.2 Probability density function
6.26.3 Related distributions
6.27 RELATIONSHIPS AMONG DISTRIBUTIONS
6.27.1 Other relationships among distributions
1889_pdf_c07.pdf
CRC STANDARD PROBABILITY AND STATISTICS TABLES AND FORMULAE
Table of Contents
CHAPTER 7: Standard Normal Distribution
7.1 THE PROBABILITY DENSITY FUNCTION AND RELATED FUNCTIONS
7.2 CRITICAL VALUES
7.3 TOLERANCE FACTORS FOR NORMAL DISTRIBUTIONS
7.3.1 Tables of tolerance intervals for normal distributions
7.4 OPERATING CHARACTERISTIC CURVES
7.4.1 One-sample Z test
7.4.2 Two-sample Z test
7.5 MULTIVARIATE NORMAL DISTRIBUTION
7.6 DISTRIBUTION OF THE CORRELATION COEFFICIENT FOR A BIVARIATE NORMAL
7.6.1 Normal approximation
7.6.2 Zero correlation coefficient for bivariate normal
7.7 CIRCULAR NORMAL PROBABILITIES
7.8 CIRCULAR ERROR PROBABILITIES
1889_pdf_c08.pdf
CRC STANDARD PROBABILITY AND STATISTICS TABLES AND FORMULAE
Table of Contents
CHAPTER 8: Estimation
8.1 DEFINITIONS
8.2 CRAMER–RAO INEQUALITY
8.3 THEOREMS
8.4 THE METHOD OF MOMENTS
8.5 THE LIKELIHOOD FUNCTION
8.6 THE METHOD OF MAXIMUM LIKELIHOOD
8.7 INVARIANCE PROPERTY OF MAXIMUM LIKELIHOOD ESTIMATORS
8.8 DIFFERENT ESTIMATORS
8.9 ESTIMATORS FOR MEAN AND STANDARD DEVIATION IN SMALL SAMPLES
8.10 ESTIMATORS FOR MEAN AND STANDARD DEVIATION IN LARGE SAMPLES
1889_pdf_c09.pdf
CRC STANDARD PROBABILITY AND STATISTICS TABLES AND FORMULAE
Table of Contents
CHAPTER 9: Confidence Intervals
9.1 DEFINITIONS
9.2 COMMON CRITICAL VALUES
9.3 SAMPLE SIZE CALCULATIONS
9.4 SUMMARY OF COMMON CONFIDENCE INTERVALS
9.5 CONFIDENCE INTERVALS: ONE SAMPLE
9.5.1 Confidence interval for mean of normal population,known variance
9.5.2 Confidence interval for mean of normal population, unknown variance
9.5.3 Confidence interval for variance of normal population
9.5.4 Confidence interval for the probability of a success in a binomial experiment
9.5.5 Confidence interval for percentiles
9.5.6 Confidence interval for medians
9.5.6.1 Table of confidence interval for medians
9.5.7 Confidence interval for parameter in a Poisson distribution
9.5.8 Confidence interval for parameter in a binomial distribution
9.6 CONFIDENCE INTERVALS:TWO SAMPLES
9.6.1 Confidence interval for difference in means, known variances
9.6.2 Confidence interval for difference in means, equal unknown variances
9.6.3 Confidence interval for difference in means, unequal unknown variances
9.6.4 Confidence interval for difference in means, paired observations
9.6.5 Ratio of variances
9.6.6 Difference in success probabilities
9.6.7 Difference in medians
9.7 FINITE POPULATION CORRECTION FACTOR
1889_pdf_c10.pdf
CRC STANDARD PROBABILITY AND STATISTICS TABLES AND FORMULAE
Table of Contents
CHAPTER 10: Hypothesis Testing
10.1 INTRODUCTION
10.1.1 Tables
10.2 THE NEYMAN–PEARSON LEMMA
10.3 LIKELIHOOD RATIO TESTS
10.4 GOODNESS OF FIT TEST
10.5 CONTINGENCY TABLES
10.6 BARTLETT’S TEST
10.6.1 Approximate test procedure
10.6.2 Tables for Bartlett’s test
10.7 COCHRAN’S TEST
10.7.1 Tables for Cochran’s test
10.8 NUMBER OF OBSERVATIONS REQUIRED FOR THE COMPARISON OF A POPULATION VARIANCE WITH A STANDARD VALUE USING THE CHI–SQUARE
10.9 CRITICAL VALUES FOR TESTING OUTLIERS
10.10 TEST OF SIGNIFICANCE IN 2x2 CONTINGENCY TABLES
10.11 DETERMINING VALUES IN BERNOULLI TRIALS
1889_pdf_c11.pdf
CRC STANDARD PROBABILITY AND STATISTICS TABLES AND FORMULAE
Table of Contents
CHAPTER 11: Regression Analysis
11.1 SIMPLE LINEAR REGRESSION
11.1.1 Least squares estimates
11.1.2 Sum of squares
11.1.3 Inferences concerning the regression coefficients
11.1.4 The mean response
11.1.5 Prediction interval
11.1.6 Analysis of variance table
11.1.7 Test for linearity of regression
11.1.8 Sample correlation coefficient
11.1.9 Example
11.2 MULTIPLE LINEAR REGRESSION
11.2.1 Least squares estimates
11.2.2 Sum of squares
11.2.3 Inferences concerning the regression coefficients
11.2.4 The mean response
11.2.5 Prediction interval
11.2.6 Analysis of variance table
11.2.7 Sequential sum of squares
11.2.8 Partial F test
11.2.9 Residual analysis
11.2.10 Example
11.3 ORTHOGONAL POLYNOMIALS
11.3.1 Tables for orthogonal polynomials
1889_pdf_c12.pdf
CRC STANDARD PROBABILITY AND STATISTICS TABLES AND FORMULAE
Table of Contents
CHAPTER 12: Analysis of Variance
12.1 ONE-WAY ANOVA
12.1.1 Sum of squares
12.1.2 Properties
12.1.3 Analysis of variance table
12.1.4 Multiple comparison procedures
12.1.4.1 Tukey’s procedure
12.1.4.2 Duncan’s multiple range test
12.1.4.3 Duncan’s multiple range test
12.1.4.4 Dunnett’s procedure
12.1.4.5 Tables for Dunnett’s procedure
12.1.5 Contrasts
12.1.6 Example
12.2 TWO-WAY ANOVA
12.2.1 One observation per cell
12.2.1.1 Models and assumptions
12.2.1.2 Sum of squares
12.2.1.3 Mean squares and properties
12.2.2 Analysis of variance table
12.2.3 Nested classifications with equal samples
12.2.3.1 Models and assumptions
12.2.3.2 Sum of squares
12.2.3.3 Mean squares and properties
12.2.3.4 Analysis of variance table
12.2.4 Nested classifications with unequal samples
12.2.4.1 Models and assumptions
12.2.4.2 Sum of squares
12.2.4.3 Mean squares and properties
12.2.4.4 Analysis of variance table
12.2.5 Two-factor experiments
12.2.5.1 Models and assumptions
12.2.5.2 Sum of squares
12.2.5.3 Mean squares and properties
12.2.5.4 Analysis of variance table
12.2.6 Example
12.3 THREE-FACTOR EXPERIMENTS
12.3.1 Models and assumptions
12.3.2 Sum of squares
12.3.3 Mean squares and properties
12.3.4 Analysis of variance table
12.4 MANOVA
12.5 FACTOR ANALYSIS
12.6 LATIN SQUARE DESIGN
12.6.1 Models and assumptions
12.6.2 Sum of squares
12.6.3 Mean squares and properties
12.6.4 Analysis of variance table
1889_pdf_c13.pdf
CRC STANDARD PROBABILITY AND STATISTICS TABLES AND FORMULAE
Table of Contents
CHAPTER 13: Experimental Design
13.1 LATIN SQUARES
13.2 GRAECO–LATIN SQUARES
13.3 BLOCK DESIGNS
13.4 FACTORIAL EXPERIMENTATION: 2 FACTORS
13.5 2 r FACTORIAL EXPERIMENTS
13.6 CONFOUNDING IN 2 N FACTORIAL EXPERIMENTS
13.7 TABLES FOR DESIGN OF EXPERIMENTS
13.7.1 Plans of factorial experiments confounded in randomized incomplete blocks
13.7.2 Plans of 2 n factorials in fractional replication
13.7.3 Plans of incomplete block designs
13.7.4 Main effect and interactions in factorial designs
13.8 REFERENCES
1889_pdf_c14.pdf
CRC STANDARD PROBABILITY AND STATISTICS TABLES AND FORMULAE
Table of Contents
CHAPTER 14: Nonparametric Statistics
14.1 FRIEDMAN TEST FOR RANDOMIZED BLOCK DESIGN
14.2 KENDALL’S RANK CORRELATION COEFFICIENT
14.2.1 Tables for Kendall rank correlation coefficient
14.3 KOLMOGOROV–SMIRNOFF TESTS
14.3.1 One-sample Kolmogorov–Smirnoff test
14.3.2 Two-sample Kolmogorov–Smirnoff test
14.3.3 Tables for Kolmogorov–Smirnoff tests
14.3.3.1 Critical values, one-sample Kolmogorov–Smirnoff test
14.3.3.2 Critical values, two-sample Kolmogorov–Smirnoff test
14.4 KRUSKAL–WALLIS TEST
14.4.1 Tables for Kruskal–Wallis test
14.5 THE RUNS TEST
14.5.1 Tables for the runs test
14.6 THE SIGN TEST
14.6.1 Table of critical values for the sign test
14.7 SPEARMAN’S RANK CORRELATION COEFFICIENT
14.7.1 Tables for Spearman’s rank correlation coefficient
14.8 WILCOXON MATCHED-PAIRS SIGNED-RANKS TEST
14.9 WILCOXON RANK –SUM (MANN –WHITNEY)TEST
14.9.1 Tables for Wilcoxon (Mann –Whitney) U statistic
14.9.2 Critical values for Wilcoxon (Mann –Whitney) statistic
14.10 WILCOXON SIGNED-RANK TEST
1889_pdf_c15.pdf
CRC STANDARD PROBABILITY AND STATISTICS TABLES AND FORMULAE
Table of Contents
CHAPTER 15: QualityControl and Risk Analysis
15.1 QUALITY ASSURANCE
15.1.1 Control charts
15.1.2 Abnormal distributions of points in control charts
15.2 ACCEPTANCE SAMPLING
15.2.1 Sequential sampling
15.2.1.1 Sequential probability ratio tests
15.2.1.2 Two-sided mean test
15.2.1.3 One-sided variance test
15.3 RELIABILITY
15.3.1 Failure time distributions
15.3.1.1 Use of the exponential distribution
15.4 RISK ANALYSIS AND DECISION RULES
1889_pdf_c16.pdf
CRC STANDARD PROBABILITY AND STATISTICS TABLES AND FORMULAE
Table of Contents
CHAPTER 16: General Linear Models
16.1 NOTATION
16.2 THE GENERAL LINEAR MODEL
16.2.1 The simple linear regression model
16.2.2 Multiple linear regression
16.2.3 One-way analysis of variance
16.2.4 Two-way analysis of variance
16.2.5 Analysis of covariance
16.3 SUMMARY OF RULES FOR MATRIX OPERATIONS
16.3.1 Linear combinations
16.3.2 Determinants and partitioning of determinants
16.3.3 Inverse of a partitioned matrix
16.3.3.1 Symmetric case
16.3.4 Eigenvalues
16.3.5 Differentiation involving vectors/matrices
16.3.5.1 Definitions
16.3.5.2 Properties
16.3.6 Additional definitions and properties
16.4 PRINCIPLE OF MINIMIZING QUADRATIC FORMS AND GAUSS MARKOV THEOREM
16.4.1 Multivariate distributions
16.4.2 The principle of least squares
16.4.3 Minimum variance unbiased estimates
16.5 GENERAL LINEAR HYPOTHESIS OF FULL RANK
16.5.1 Notation
16.5.2 Simple linear regression
16.5.3 Analysis of variance, one-way anova
16.5.4 Multiple linear regression
16.5.5 Randomized blocks (one observation per cell)
16.5.6 Quadratic form due to hypothesis
16.5.7 Sum of squares due to error
16.5.8 Summary
16.5.9 Computation procedure for hypothesis testing
16.5.10 Regression significance test
16.5.11 Alternate form of the distribution
16.6 GENERAL LINEAR MODEL OF LESS THAN FULL RANK
16.6.1 Estimable function and estimability
16.6.2 General linear hypothesis model of less than full rank
16.6.2.1 Sum of squares due to error
16.6.2.2 Sum of squares due to hypothesis
16.6.3 Constraints and conditions
1889_pdf_c17.pdf
CRC STANDARD PROBABILITY AND STATISTICS TABLES AND FORMULAE
Table of Contents
CHAPTER 17: Miscellaneous Topics
17.1 GEOMETRIC PROBABILITY
17.2 INFORMATION AND COMMUNICATION THEORY
17.2.1 Discrete entropy
17.2.2 Continuous entropy
17.2.3 Channel capacity
17.2.4 Shannon's theorem
17.3 KALMAN FILTERING
17.3.1 Extended Kalman filtering
17.4 LARGE DEVIATIONS (THEORY OF RARE EVENTS)
17.4.1 Theory
17.4.2 Sample rate functions
17.4.3 Example: Insurance company
17.5 MARKOV CHAINS
17.5.1 Transition function
17.5.2 Transition matrix
17.5.3 Recurrence
17.5.4 Stationary distributions
17.5.5 Random walks
17.5.6 Ehrenfest chain
17.6 MARTINGALES
17.6.1 Examples of martingales
17.7 MEASURE THEORETICAL PROBABILITY
17.8 MONTE CARLO INTEGRATION TECHNIQUES
17.8.1 Importance sampling
17.8.2 Hit-or-miss Monte Carlo method
17.9 QUEUING THEORY
17.9.1 M/M/1 queue
17.9.2 M/M/1 /K queue
17.9.3 M/M/2 queue
17.9.4 M/M/c queue
17.9.5 M/M/c/c queue
17.9.6 M/M/c/K queue
17.9.7 M/M/ •queue
17.9.8 M/E k /1 queue
17.9.9 M/D/1 queue
17.10 RANDOM MATRIX EIGENVALUES
17.10.1 Random matrix products
17.10.1.1 Vibonacci numbers
17.11 RANDOM NUMBER GENERATION
17.11.1 Methods of pseudorandom number generation
17.11.1.1 Linear congruential generators
17.11.1.2 Shift register generators
17.11.1.3 Lagged-Fibonacci generators
17.11.2 Generating nonuniform random variables
17.11.2.1 Discrete random variables
17.11.2.2 Testing pseudorandom numbers
17.11.3 References
17.12 RESAMPLING METHODS
17.13 SELF-SIMILAR PROCESSES
17.13.1 Definitions
17.13.2 Self-similar processes
17.14 SIGNAL PROCESSING
17.14.1 Estimation
17.14.2 Matched filtering (Wiener filter)
17.14.3 Median filter
17.14.4 Mean filter
17.14.5 Spectral decomposition of stationary random functions
17.15 STOCHASTIC CALCULUS
17.15.1 Brownian motion (Wiener processes)
17.15.2 Brownian motion expectations
17.15.3 Itô lemma
17.15.4 Stochastic integration
17.15.5 Stochastic differential equations
17.15.6 Motion in a domain
17.15.7 Option Pricing
17.16 CLASSIC AND INTERESTING PROBLEMS
17.16.1 Approximating a distribution
17.16.2 Averages over vectors
17.16.3 Bertrand’s box “paradox ”
17.16.4 Bertrand’s circle “paradox ”
17.16.5 Bingo cards: nontransitive
17.16.6 Birthday problem
17.16.7 Buffon’s needle problem
17.16.8 Card problems
17.16.8.1 Shuffling cards
17.16.8.2 Card games
17.16.9 Coin problems
17.16.9.1 Even odds from a biased coin
17.16.9.2 Two heads in a row
17.16.10 Coupon collectors problem
17.16.11 Dice problems
17.16.11.1 Dice: nontransitive (Efron)
17.16.11.2 Dice: distribution of sums
17.16.11.3 Dice: same distribution
17.16.12 Ehrenfest urn model
17.16.13 Envelope problem “paradox ”
17.16.14 Gambler ’s ruin problem
17.16.15 Gender distributions
17.16.16 Holtzmark distribution: stars in the galaxy
17.16.17 Large-scale testing
17.16.17.1 Infrequent success
17.16.17.2 Pooling of blood samples
17.16.18 Leading digit distribution
17.16.18.1 Ratio of uniform numbers
17.16.18.2 Benford’s law
17.16.19 Lotteries
17.16.20 Match box problem
17.16.21 Maximum entropy distributions
17.16.22 Monte Hall problem
17.16.23 Multi-armed bandit problem
17.16.24 Parking problem
17.16.25 Passage problems
17.16.26 Proofreading mistakes
17.16.27 Raisin cookie problem
17.16.28 Random sequences
17.16.28.1 Long runs
17.16.28.2 Waiting times: two types of characters
17.16.28.3 Waiting times: many types of characters
17.16.28.4 First random sequence
17.16.29 Random walks
17.16.29.1 Random walk on a grid
17.16.29.2 Random walk in two dimensions (Rayleigh problem)
17.16.29.3 Random walk in three dimensions
17.16.29.4 Self-avoiding walks
17.16.30 Relatively prime integers
17.16.31 Roots of a random polynomial
17.16.32 Roots of a random quadratic
17.16.33 Simpson paradox
17.16.34 Secretary call problem
17.16.35 Waiting for a bus
17.17 ELECTRONIC RESOURCES
17.17.1 Statlib
17.17.2 Uniform resource locators
17.17.3 Interactive demonstrations and tutorials
17.17.4 Online textbooks, reference manuals, and journals
17.17.5 Free statistical software packages
17.17.6 Demonstration statistical software packages
17.18 TABLES
17.18.1 Random deviates
17.18.2 Permutations
17.18.3 Combinations
1889_pdf_c18.pdf
CRC STANDARD PROBABILITY AND STATISTICS TABLES AND FORMULAE
Table of Contents
CHAPTER 18: Special Functions
18.1 BESSEL FUNCTIONS
18.1.1 Differential equation
18.1.2 Series expansions
18.1.3 Recurrence relations
18.1.4 Behavior as z •0
18.1.5 Integral representations
18.1.6 Fourier expansion
18.1.7 Asymptotic expansions
18.1.8 Half-order Bessel functions
18.1.9 Modified Bessel functions
18.1.9.1 Relation to ordinary Bessel functions
18.1.9.2 Recursion relations
18.1.9.3 Integrals
18.2 BETA FUNCTION
18.2.1 Other integrals
18.2.2 Properties
18.3 CEILING AND FLOOR FUNCTIONS
18.4 DEL A FUNCTION
18.5 ERROR FUNCTIONS
18.5.1 Expansions
18.5.2 Special values
18.6 EXPONENTIAL FUNCTION
18.6.1 Exponentiation
18.6.2 Definition of e z
18.6.3 Derivative and integral of e z
18.6.4 Circular functions and exponentials
18.6.5 Hyperbolic functions
18.7 FACTORIALS AND POCHHAMMER'S SYMBOL
18.8 GAMMA FUNCTION
18.8.1 Other integrals for the gamma function
18.8.2 Properties
18.8.3 Expansions
18.8.4 Special values
18.8.5 Digamma function
18.8.6 Incomplete gamma functions
18.9 HYPERGEOMETRIC FUNCTIONS
18.9.1 Generalized hypergeometric function
18.9.2 Gauss hypergeometric function
18.9.2.1 Special cases
18.9.2.2 Functional relations
18.9.3 Confluent hypergeometric functions
18.10 LOGARITHMIC FUNCTIONS
18.10.1 Definition of the natural log
18.10.2 Special values
18.10.3 Logarithms to a base other than e
18.10.4 Relation of the logarithm to the exponential
18.10.5 Identities
18.10.6 Series expansions for the natural logarithm
18.10.7 Derivative and integration formulae
18.11 PARTITIONS
18.12 SIGNUM FUNCTION
18.13 STIRLING NUMBERS
18.13.1 Stirling numbers
18.13.2 Stirling cycle numbers
18.14 SUMS OF POWERS OF INTEGERS
18.15 TABLES OF ORTHOGONAL POLYNOMIALS
18.16 REFERENCES
1889_pdf_lon.pdf
CRC STANDARD PROBABILITY AND STATISTICS TABLES AND FORMULAE
Table of Contents
List of Notation
Symbols
Greek Letters
Numbers
A
B
C
D
E
F
G
H
I
J
K
L
M
N
P
Q
R
S
T
U
V
W
X
Y
Z



 2023年江西萍乡中考道德与法治真题及答案.doc
 2012年重庆南川中考生物真题及答案.doc
 2013年江西师范大学地理学综合及文艺理论基础考研真题.doc
 2020年四川甘孜小升初语文真题及答案I卷.doc
 2020年注册岩土工程师专业基础考试真题及答案.doc
 2023-2024学年福建省厦门市九年级上学期数学月考试题及答案.doc
 2021-2022学年辽宁省沈阳市大东区九年级上学期语文期末试题及答案.doc
 2022-2023学年北京东城区初三第一学期物理期末试卷及答案.doc
 2018上半年江西教师资格初中地理学科知识与教学能力真题及答案.doc
 2012年河北国家公务员申论考试真题及答案-省级.doc
 2020-2021学年江苏省扬州市江都区邵樊片九年级上学期数学第一次质量检测试题及答案.doc
 2022下半年黑龙江教师资格证中学综合素质真题及答案.doc