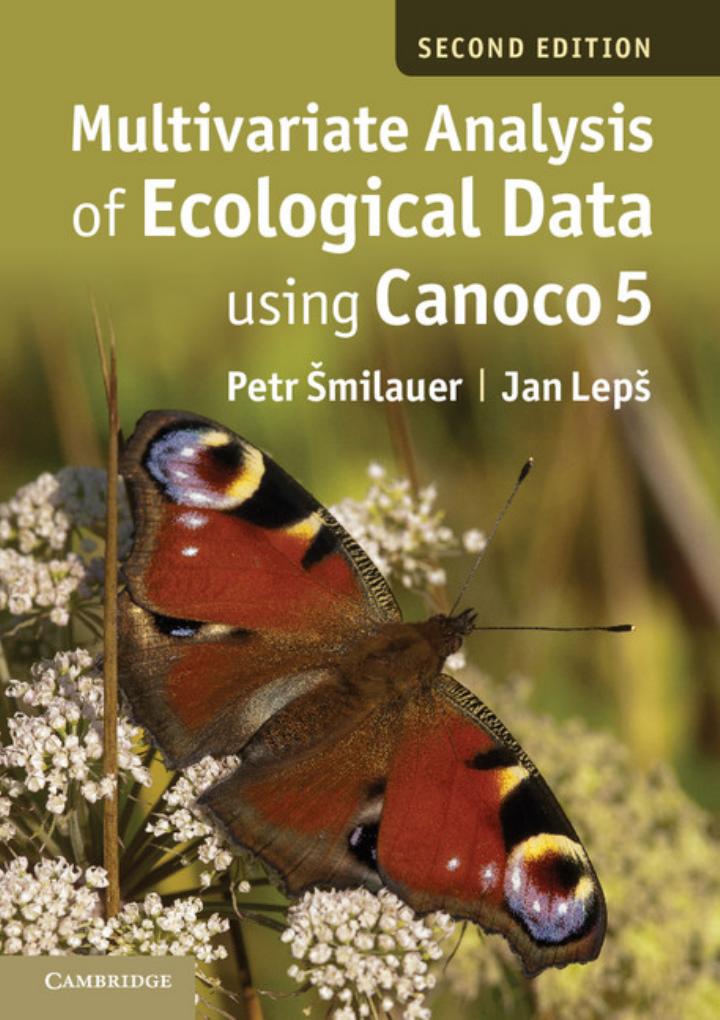
Cover
Half title
Title
Copyright
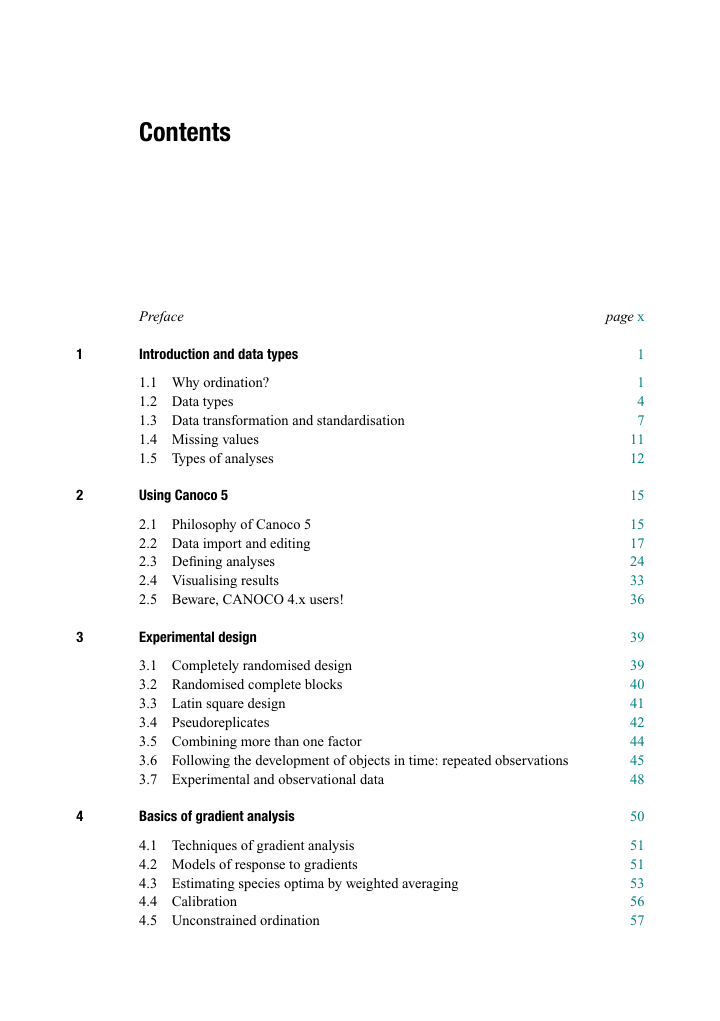
Contents
Preface
1 Introduction and data types
1.1 Why ordination?
1.2 Data types
1.3 Data transformation and standardisation
1.3.1 Transformation
1.3.2 Standardisation
1.4 Missing values
1.5 Types of analyses
2 Using Canoco 5
2.1 Philosophy of Canoco 5
2.2 Data import and editing
2.3 Defining analyses
2.4 Visualising results
2.5 Beware, CANOCO 4.x users!
3 Experimental design
3.1 Completely randomised design
3.2 Randomised complete blocks
3.3 Latin square design
3.4 Pseudoreplicates
3.5 Combining more than one factor
3.5.1 Factorial designs
3.5.2 Hierarchical designs
3.6 Following the development of objects in time: repeated observations
3.7 Experimental and observational data
4 Basics of gradient analysis
4.1 Techniques of gradient analysis
4.2 Models of response to gradients
4.3 Estimating species optima by weighted averaging
4.4 Calibration
4.5 Unconstrained ordination
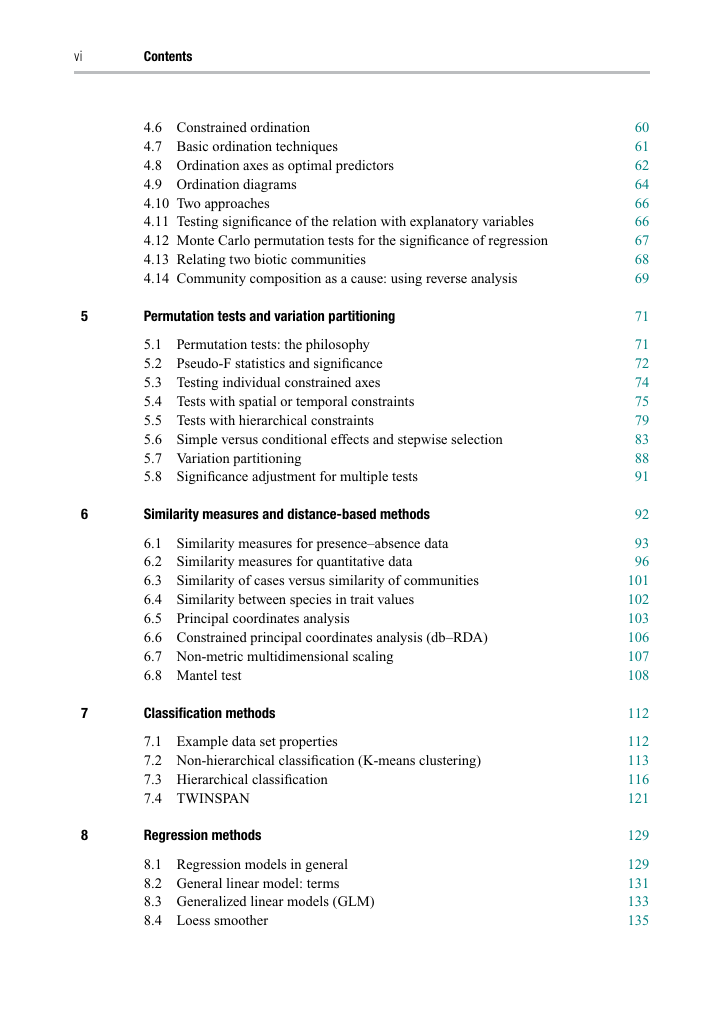
4.6 Constrained ordination
4.7 Basic ordination techniques
4.8 Ordination axes as optimal predictors
4.9 Ordination diagrams
4.10 Two approaches
4.11 Testing significance of the relation with explanatory variables
4.12 Monte Carlo permutation tests for the significance of regression
4.13 Relating two biotic communities
4.14 Community composition as a cause: using reverse analysis
5 Permutation tests and variation partitioning
5.1 Permutation tests: the philosophy
5.2 Pseudo-F statistics and significance
5.3 Testing individual constrained axes
5.4 Tests with spatial or temporal constraints
5.5 Tests with hierarchical constraints
5.6 Simple versus conditional effects and stepwise selection
5.7 Variation partitioning
5.8 Significance adjustment for multiple tests
6 Similarity measures and distance-based methods
6.1 Similarity measures for presence-absence data
6.2 Similarity measures for quantitative data
6.2.1 Measuring and transforming the quantity
6.2.2 Similarity or distance between cases
6.2.3 Similarity between species
6.3 Similarity of cases versus similarity of communities
6.4 Similarity between species in trait values
6.5 Principal coordinates analysis
6.6 Constrained principal coordinates analysis (dbRDA)
6.7 Non-metric multidimensional scaling
6.8 Mantel test
7 Classification methods
7.1 Example data set properties
7.2 Non-hierarchical classification (K-means clustering)
7.3 Hierarchical classification
7.3.1 Agglomerative classification (cluster analysis)
7.3.2 Divisive classification
7.4 TWINSPAN
7.4.1 TWINSPAN analysis of the Tatry data
8 Regression methods
8.1 Regression models in general
8.2 General linear model: terms
8.3 Generalized linear models (GLM)
8.4 Loess smoother
8.5 Generalized additive models (GAM)
8.6 Mixed-effect models (LMM, GLMM and GAMM)
8.7 Classification and regression trees (CART)
8.8 Modelling species response curves with Canoco
9 Interpreting community composition with functional traits
9.1 Required data
9.2 Two approaches in traits - environment studies
9.3 Community-based approach
9.4 Species-based approach
9.4.1 Selection of species
9.4.2 Predicting response to each environmental variable separately
10 Advanced use of ordination
10.1 Principal response curves (PRC)
10.2 Separating spatial variation
10.3 Linear discriminant analysis
10.4 Hierarchical analysis of community variation
Total variation
Variation among ranges
Variation among ridges
Variation among peaks
Residual variation
10.5 Partitioning diversity indices into alpha and beta components
10.6 Predicting community composition
11 Visualising multivariate data
11.1 Reading ordination diagrams of linear methods
11.2 Reading ordination diagrams of unimodal methods
11.3 Attribute plots
11.4 Visualising classification, groups, and sequences
11.5 T-value biplot
12 Case study 1: Variation in forest bird assemblages
12.1 Unconstrained ordination: portraying variation in bird community
12.2 Simple constrained ordination: the effect of altitude on bird community
12.3 Partial constrained ordination: additional effect of other habitat characteristics
12.4 Separating and testing alpha and beta diversity
13 Case study 2: Search for community composition patterns and their environmental correlates: vegetation of spring meadows
13.1 Unconstrained ordination
13.2 Constrained ordination
13.3 Classification
13.4 Suggestions for additional analyses
13.5 Comparing two communities
14 Case study 3: Separating the effects of explanatory variables
14.1 Introduction
14.2 Data
14.3 Changes in species richness and composition
14.4 Changes in species traits
15 Case study 4: Evaluation of experiments in randomised complete blocks
15.1 Introduction
15.2 Data
15.3 Analysis
15.4 Calculating ANOVA using constrained ordination
16 Case study 5: Analysis of repeated observations of species composition from a factorial experiment
16.1 Introduction
16.2 Experimental design
16.3 Data coding and use
16.4 Univariate analyses
16.5 Constrained ordinations
16.6 Principal response curves
16.7 Temporal changes across treatments
16.8 Changes in composition of functional traits
16.8.1 Response of community weighted means of traits to treatments
16.8.2 Species-based approaches
17 Case study 6: Hierarchical analysis of crayfish community variation
17.1 Data and design
17.2 Differences among sampling locations
17.3 Hierarchical decomposition of community variation
18 Case study 7: Analysis of taxonomic data with discriminant analysis and distance-based ordination
18.1 Data
18.2 Summarising morphological data with PCA
18.3 Linear discriminant analysis of morphological data
18.4 Principal coordinates analysis of AFLP data
18.5 Testing taxon differences in AFLP data using db-RDA
18.6 Taking populations into account
19 Case study 8: Separating effects of space and environment on oribatid community with PCNM
19.1 Ignoring the space
19.2 Detecting spatial trends
19.3 All-scale spatial variation of community and environment
19.4 Variation partitioning with spatial predictors
19.5 Visualising spatial variation
20 Case study 9: Performing linear regression with redundancy analysis
20.1 Data
20.2 Linear regression using program R
20.3 Linear regression with redundancy analysis
20.4 Fitting generalized linear models in Canoco
Appendix A Glossary
Appendix B Sample data sets and projects
Appendix C Access to Canoco and overview of other software
Appendix D Working with R
References
Index to useful tasks in Canoco 5
Subject index





 2023年江西萍乡中考道德与法治真题及答案.doc
 2012年重庆南川中考生物真题及答案.doc
 2013年江西师范大学地理学综合及文艺理论基础考研真题.doc
 2020年四川甘孜小升初语文真题及答案I卷.doc
 2020年注册岩土工程师专业基础考试真题及答案.doc
 2023-2024学年福建省厦门市九年级上学期数学月考试题及答案.doc
 2021-2022学年辽宁省沈阳市大东区九年级上学期语文期末试题及答案.doc
 2022-2023学年北京东城区初三第一学期物理期末试卷及答案.doc
 2018上半年江西教师资格初中地理学科知识与教学能力真题及答案.doc
 2012年河北国家公务员申论考试真题及答案-省级.doc
 2020-2021学年江苏省扬州市江都区邵樊片九年级上学期数学第一次质量检测试题及答案.doc
 2022下半年黑龙江教师资格证中学综合素质真题及答案.doc