Pandas tutorial
Pandas 是 Python 语言下的一个用于数据分析的工具类库。使用 Pandas 可以方便的对数据
进行处理和分析。
1. Data Structures
Pandas 处理数据靠的是两个核心数据结构,Series 和 DataFrame,将会贯穿于整个数据分
析过程。
Series 用来处理一维的序列数据,而 DataFrame 用来处理更复杂的多维数据。
1.1. Series
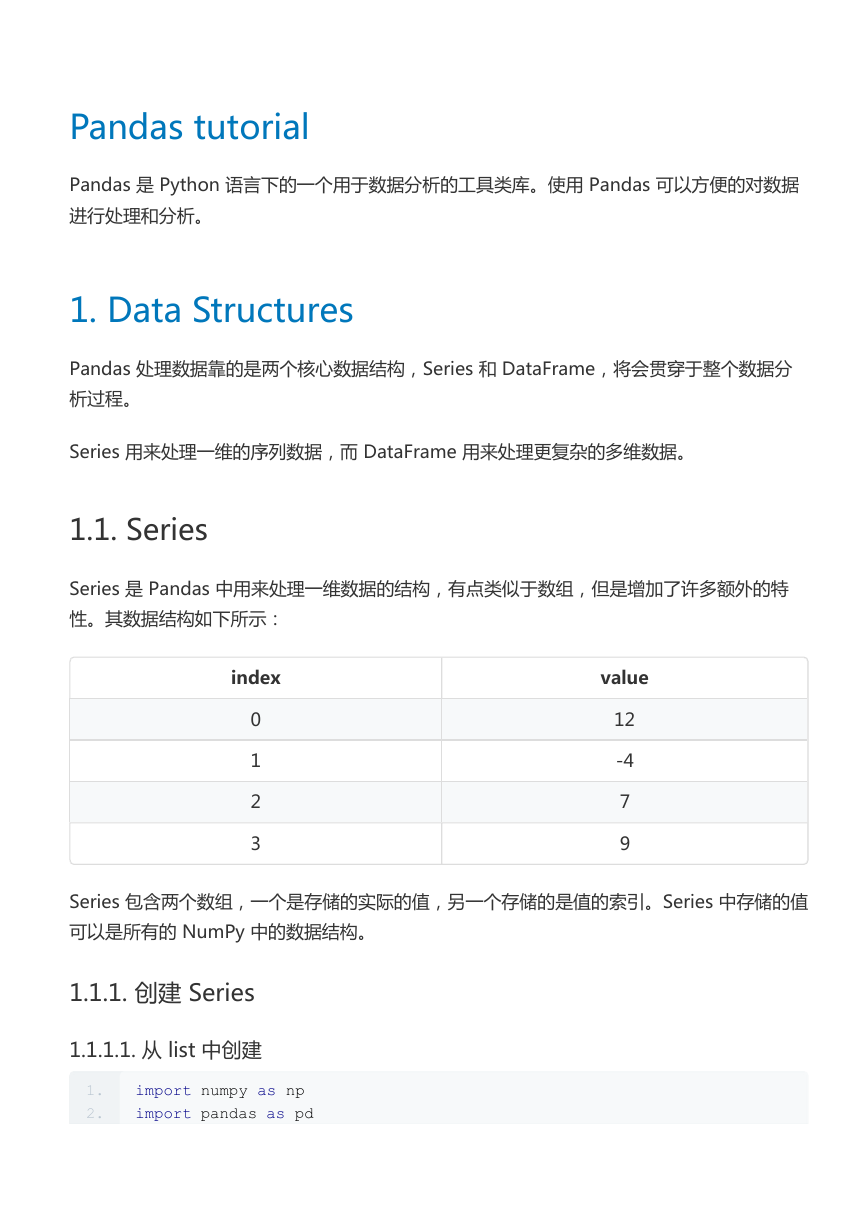
Series 是 Pandas 中用来处理一维数据的结构,有点类似于数组,但是增加了许多额外的特
性。其数据结构如下所示:
index
0
1
2
3
value
12
-4
7
9
Series 包含两个数组,一个是存储的实际的值,另一个存储的是值的索引。Series 中存储的值
可以是所有的 NumPy 中的数据结构。
1.1.1. 创建 Series
1.1.1.1. 从 list 中创建
1.
2.
import numpy as np
import pandas as pd
�
3.
4.
5.
s = pd.Series([12, -4, 7, 9])
print(s)
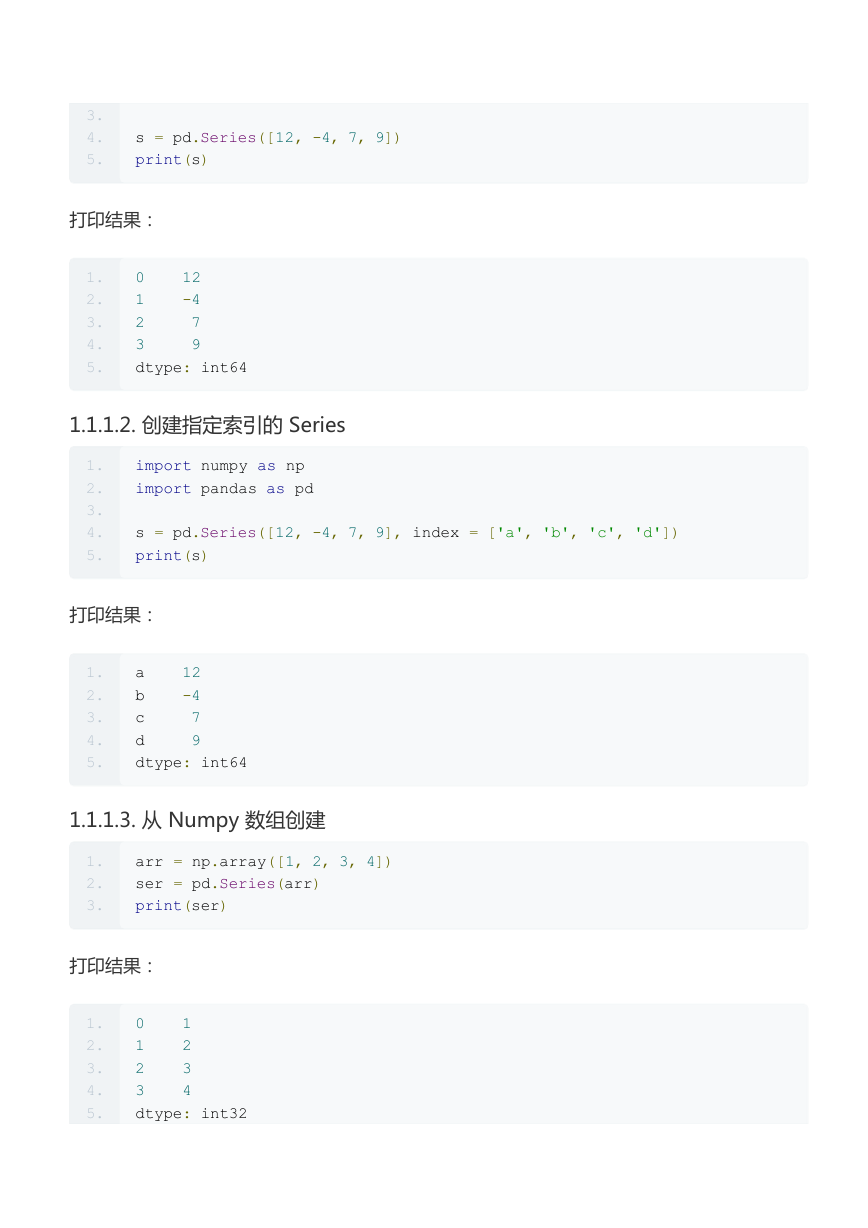
打印结果:
1.
2.
3.
4.
5.
0 12
1 -4
2 7
3 9
dtype: int64
1.1.1.2. 创建指定索引的 Series
1.
2.
3.
4.
5.
import numpy as np
import pandas as pd
s = pd.Series([12, -4, 7, 9], index = ['a', 'b', 'c', 'd'])
print(s)
打印结果:
1.
2.
3.
4.
5.
a 12
b -4
c 7
d 9
dtype: int64
1.1.1.3. 从 Numpy 数组创建
1.
2.
3.
arr = np.array([1, 2, 3, 4])
ser = pd.Series(arr)
print(ser)
打印结果:
1.
2.
3.
4.
5.
0 1
1 2
2 3
3 4
dtype: int32
�
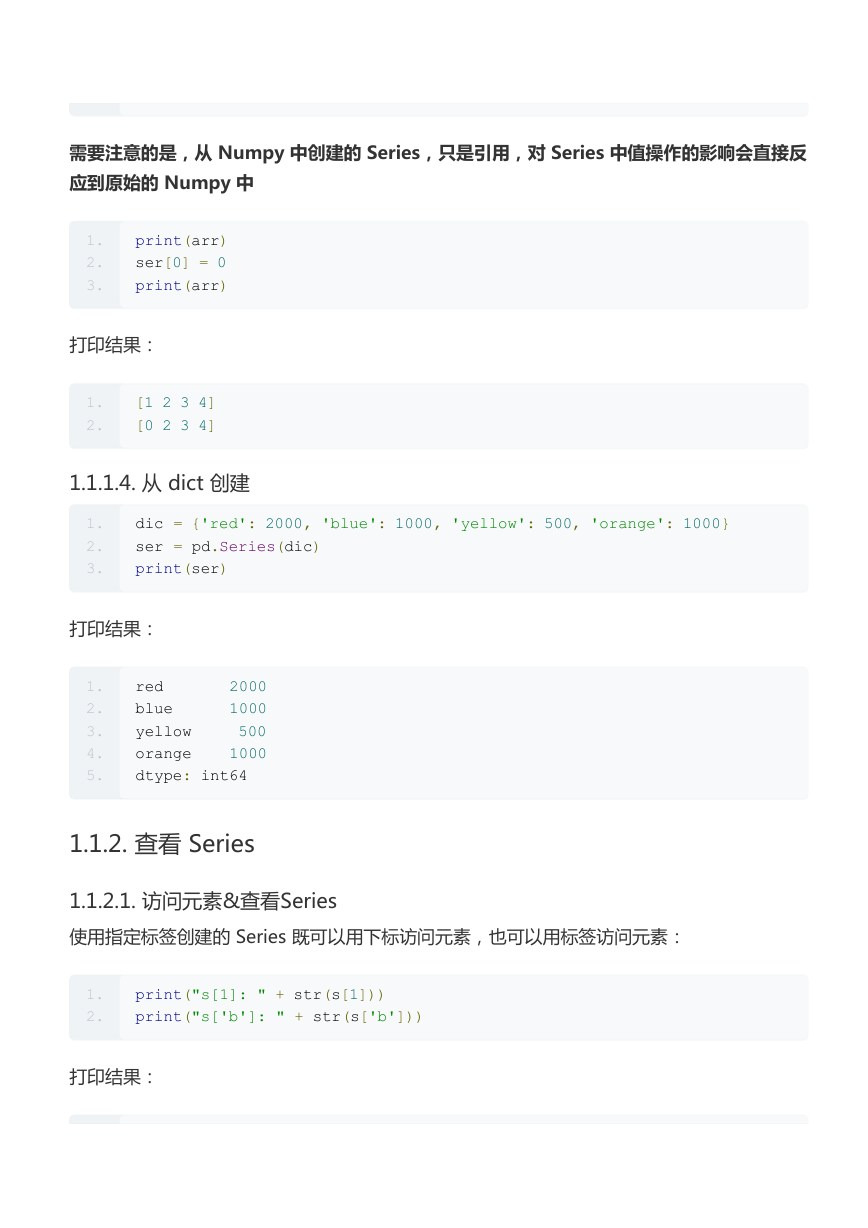
需要注意的是,从 Numpy 中创建的 Series,只是引用,对 Series 中值操作的影响会直接反
应到原始的 Numpy 中
1.
2.
3.
print(arr)
ser[0] = 0
print(arr)
打印结果:
1.
2.
[1 2 3 4]
[0 2 3 4]
1.1.1.4. 从 dict 创建
1.
2.
3.
dic = {'red': 2000, 'blue': 1000, 'yellow': 500, 'orange': 1000}
ser = pd.Series(dic)
print(ser)
打印结果:
1.
2.
3.
4.
5.
red 2000
blue 1000
yellow 500
orange 1000
dtype: int64
1.1.2. 查看 Series
1.1.2.1. 访问元素&查看Series
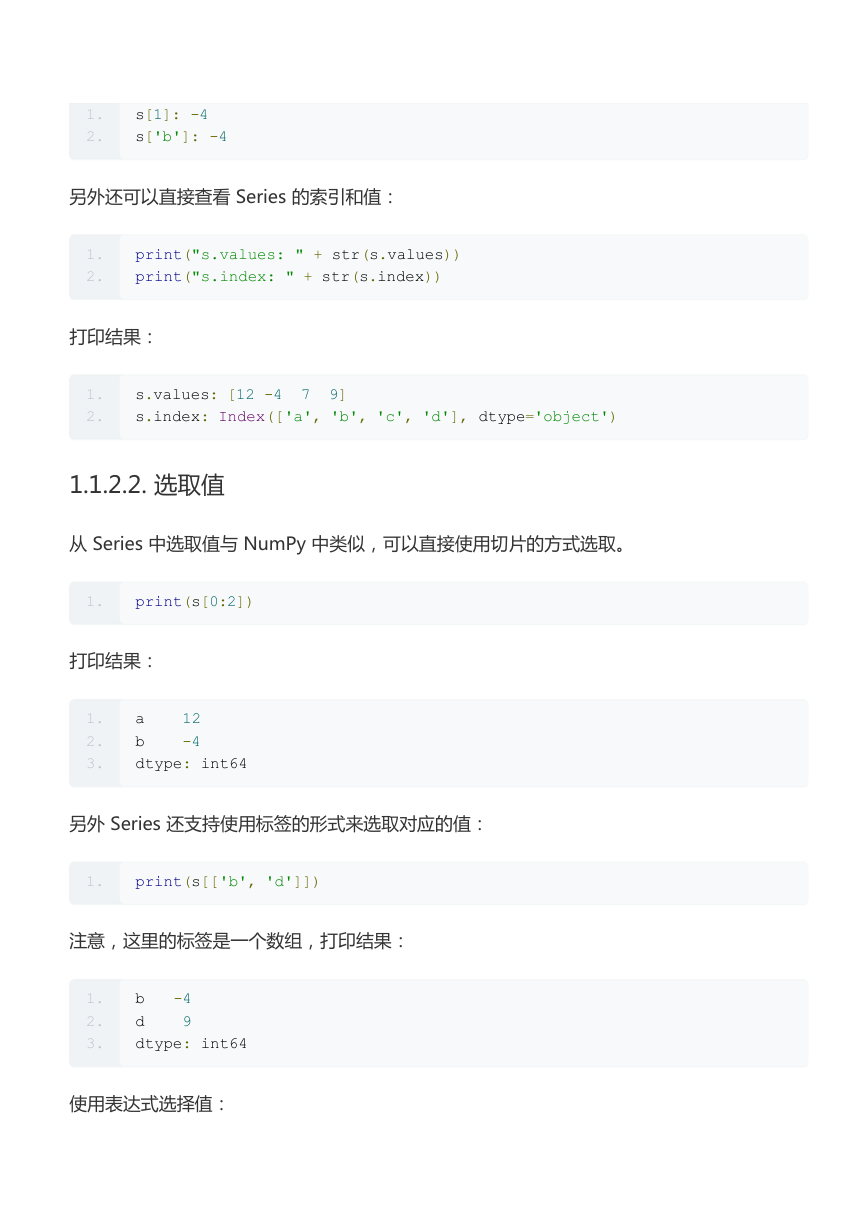
使用指定标签创建的 Series 既可以用下标访问元素,也可以用标签访问元素:
1.
2.
print("s[1]: " + str(s[1]))
print("s['b']: " + str(s['b']))
打印结果:
�
1.
2.
s[1]: -4
s['b']: -4
另外还可以直接查看 Series 的索引和值:
1.
2.
print("s.values: " + str(s.values))
print("s.index: " + str(s.index))
打印结果:
1.
2.
s.values: [12 -4 7 9]
s.index: Index(['a', 'b', 'c', 'd'], dtype='object')
1.1.2.2. 选取值
从 Series 中选取值与 NumPy 中类似,可以直接使用切片的方式选取。
1.
print(s[0:2])
打印结果:
1.
2.
3.
a 12
b -4
dtype: int64
另外 Series 还支持使用标签的形式来选取对应的值:
1.
print(s[['b', 'd']])
注意,这里的标签是一个数组,打印结果:
1.
2.
3.
b -4
d 9
dtype: int64
使用表达式选择值:
�
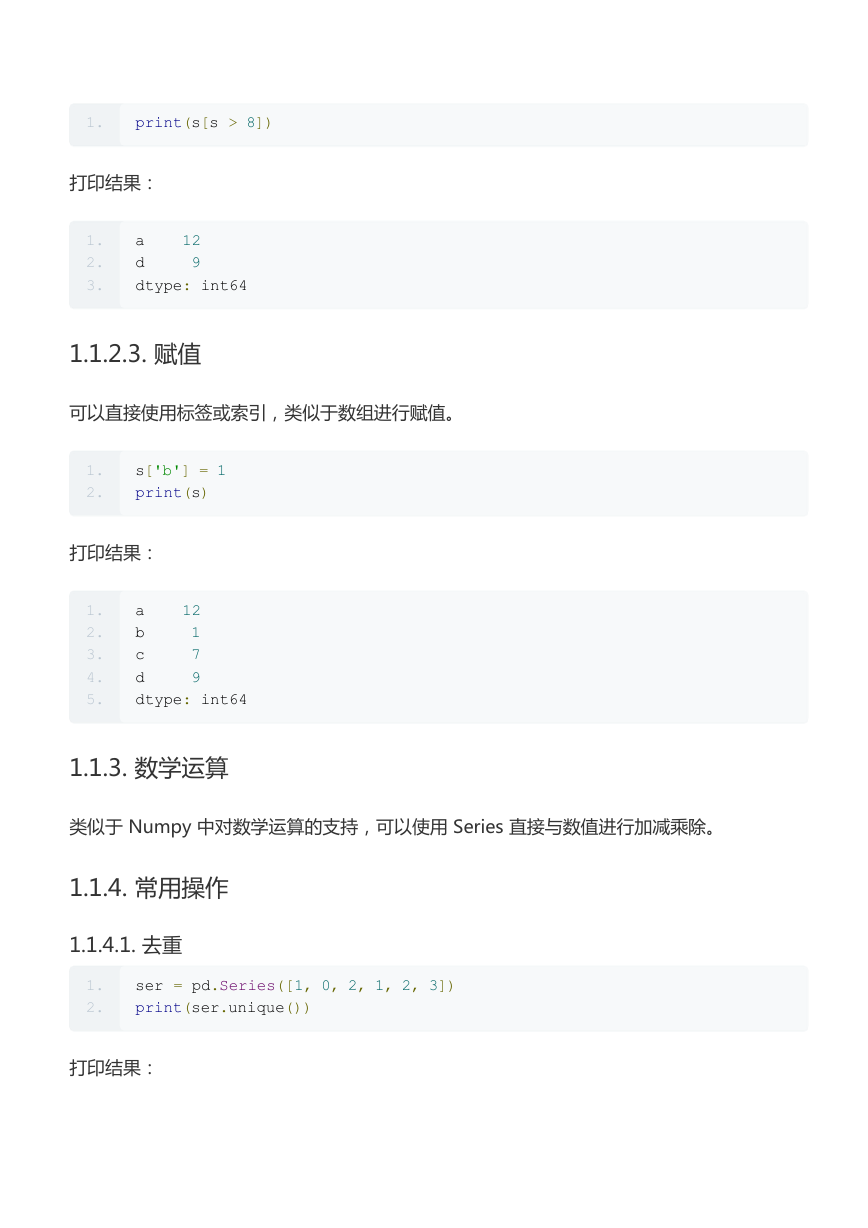
1.
print(s[s > 8])
打印结果:
1.
2.
3.
a 12
d 9
dtype: int64
1.1.2.3. 赋值
可以直接使用标签或索引,类似于数组进行赋值。
1.
2.
s['b'] = 1
print(s)
打印结果:
1.
2.
3.
4.
5.
a 12
b 1
c 7
d 9
dtype: int64
1.1.3. 数学运算
类似于 Numpy 中对数学运算的支持,可以使用 Series 直接与数值进行加减乘除。
1.1.4. 常用操作
1.1.4.1. 去重
1.
2.
ser = pd.Series([1, 0, 2, 1, 2, 3])
print(ser.unique())
打印结果:
�
1.
[1 0 2 3]
1.1.4.2. 统计
1.
2.
ser = pd.Series([1, 0, 2, 1, 2, 3])
print(ser.value_counts())
打印结果:
1.
2.
3.
4.
5.
2 2
1 2
3 1
0 1
dtype: int64
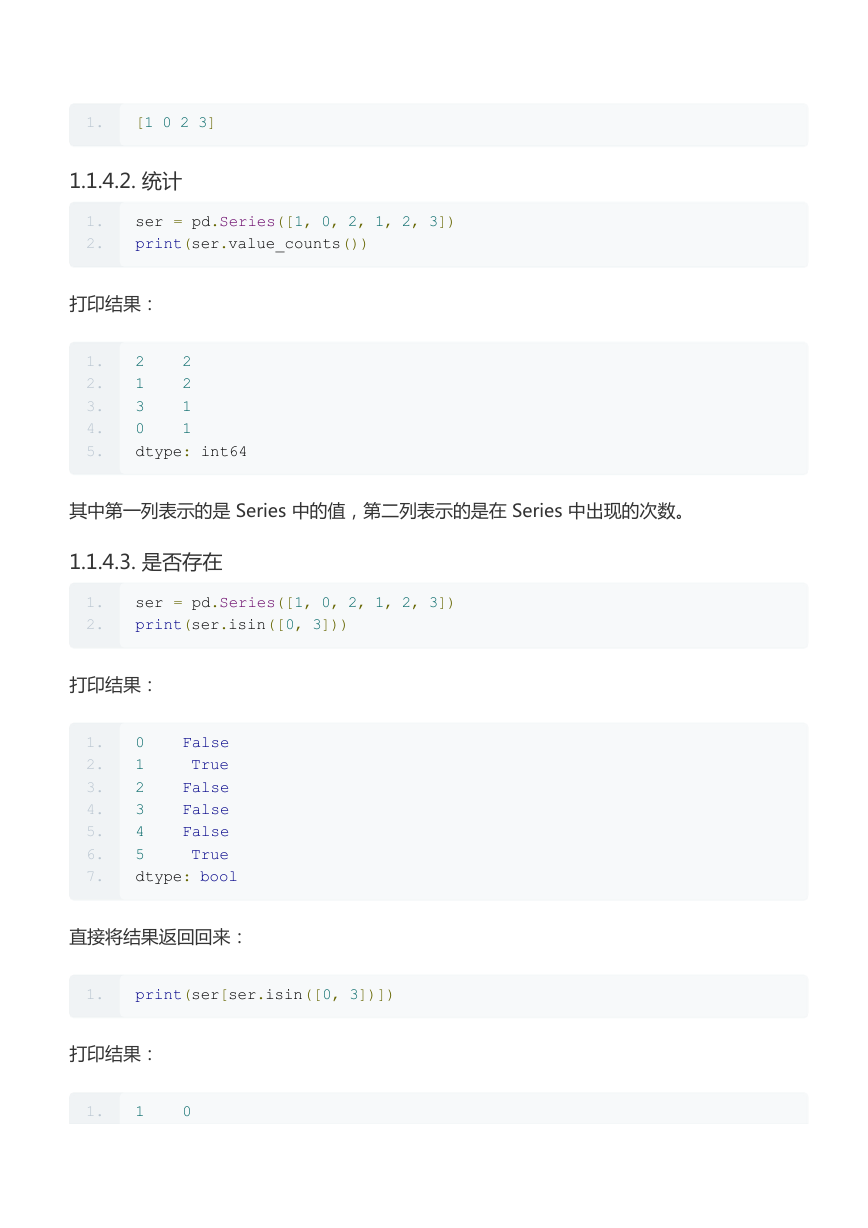
其中第一列表示的是 Series 中的值,第二列表示的是在 Series 中出现的次数。
1.1.4.3. 是否存在
1.
2.
ser = pd.Series([1, 0, 2, 1, 2, 3])
print(ser.isin([0, 3]))
打印结果:
1.
2.
3.
4.
5.
6.
7.
0 False
1 True
2 False
3 False
4 False
5 True
dtype: bool
直接将结果返回回来:
1.
print(ser[ser.isin([0, 3])])
打印结果:
1.
1 0
�
2.
3.
5 3
dtype: int64
1.1.4.4. 空值
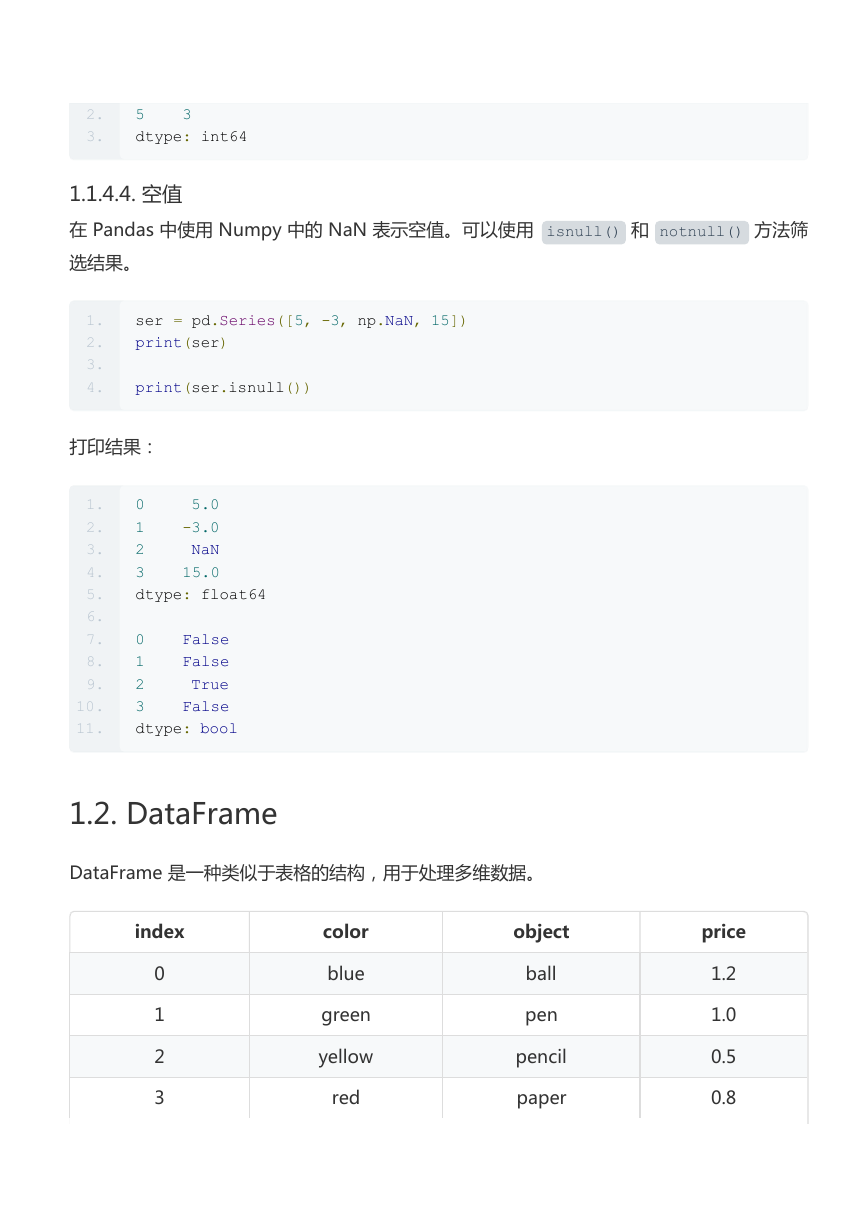
在 Pandas 中使用 Numpy 中的 NaN 表示空值。可以使用 isnull() 和 notnull() 方法筛
选结果。
1.
2.
3.
4.
ser = pd.Series([5, -3, np.NaN, 15])
print(ser)
print(ser.isnull())
打印结果:
1.
2.
3.
4.
5.
6.
7.
8.
9.
10.
11.
0 5.0
1 -3.0
2 NaN
3 15.0
dtype: float64
0 False
1 False
2 True
3 False
dtype: bool
1.2. DataFrame
DataFrame 是一种类似于表格的结构,用于处理多维数据。
index
0
1
2
3
color
blue
green
yellow
red
object
ball
pen
pencil
paper
price
1.2
1.0
0.5
0.8
�
index
4
color
white
object
mug
price
1.5
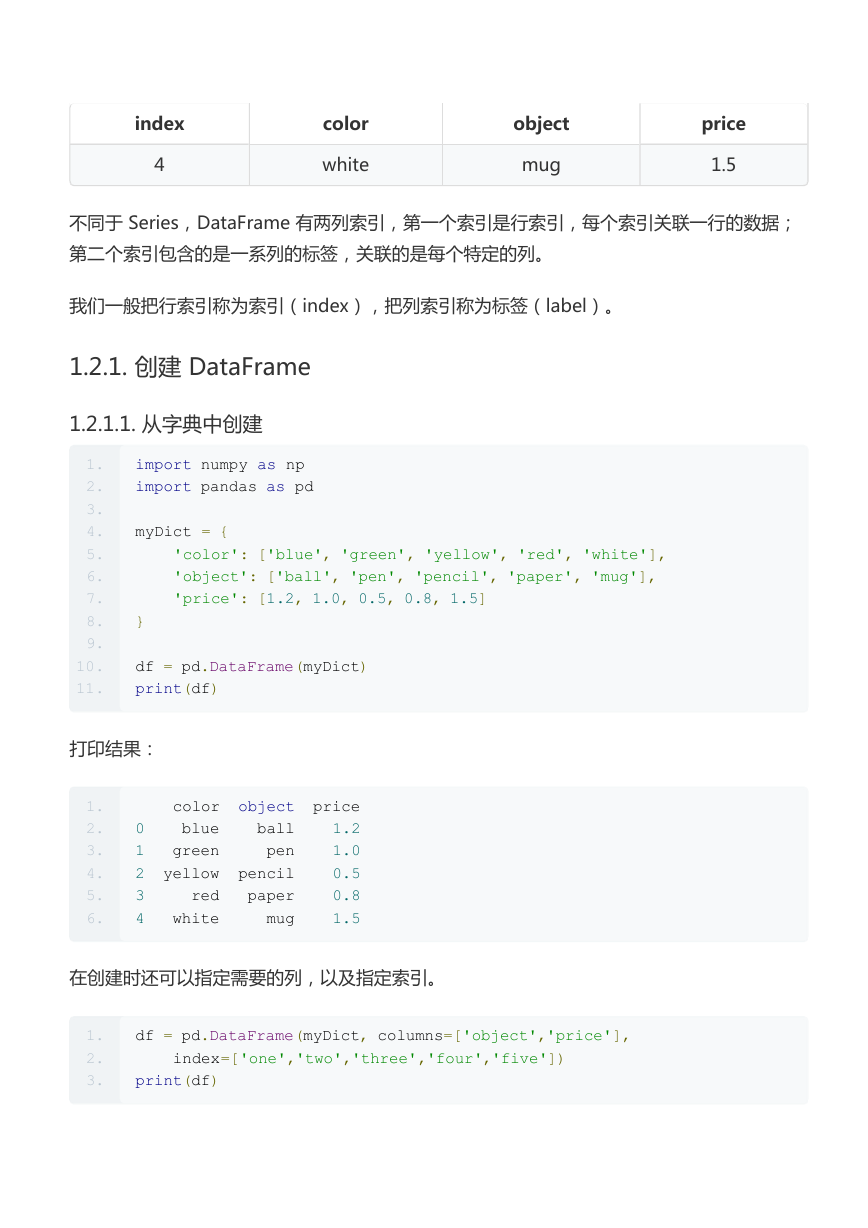
不同于 Series,DataFrame 有两列索引,第一个索引是行索引,每个索引关联一行的数据;
第二个索引包含的是一系列的标签,关联的是每个特定的列。
我们一般把行索引称为索引(index),把列索引称为标签(label)。
1.2.1. 创建 DataFrame
1.2.1.1. 从字典中创建
1.
2.
3.
4.
5.
6.
7.
8.
9.
10.
11.
import numpy as np
import pandas as pd
myDict = {
'color': ['blue', 'green', 'yellow', 'red', 'white'],
'object': ['ball', 'pen', 'pencil', 'paper', 'mug'],
'price': [1.2, 1.0, 0.5, 0.8, 1.5]
}
df = pd.DataFrame(myDict)
print(df)
打印结果:
1.
2.
3.
4.
5.
6.
color object price
0 blue ball 1.2
1 green pen 1.0
2 yellow pencil 0.5
3 red paper 0.8
4 white mug 1.5
在创建时还可以指定需要的列,以及指定索引。
1.
2.
3.
df = pd.DataFrame(myDict, columns=['object','price'],
index=['one','two','three','four','five'])
print(df)
�


 2023年江西萍乡中考道德与法治真题及答案.doc
 2012年重庆南川中考生物真题及答案.doc
 2013年江西师范大学地理学综合及文艺理论基础考研真题.doc
 2020年四川甘孜小升初语文真题及答案I卷.doc
 2020年注册岩土工程师专业基础考试真题及答案.doc
 2023-2024学年福建省厦门市九年级上学期数学月考试题及答案.doc
 2021-2022学年辽宁省沈阳市大东区九年级上学期语文期末试题及答案.doc
 2022-2023学年北京东城区初三第一学期物理期末试卷及答案.doc
 2018上半年江西教师资格初中地理学科知识与教学能力真题及答案.doc
 2012年河北国家公务员申论考试真题及答案-省级.doc
 2020-2021学年江苏省扬州市江都区邵樊片九年级上学期数学第一次质量检测试题及答案.doc
 2022下半年黑龙江教师资格证中学综合素质真题及答案.doc