Geostatistical Earth Modeling Software:
User’s Manual
Nicolas Remy
May 2004
�
Contents
1 General Overview
.
.
. .
. .
.
.
.
. .
.
. .
.
.
.
. .
. .
. .
1.1 First Steps with GEMS .
. .
1.1.1 A quick tour to the graphical user interface . .
. .
1.1.2 A simple tutorial
.
1.1.3 Automating tasks in GEMS .
. .
.
. .
. .
.
.
. .
. .
.
. .
.
.
. .
1.2 Defining a 3-D ellipsoid .
. .
1.3 Variogram Model Specification . .
1.4 File Formats . .
. .
. .
. .
. .
.
1.4.1 Objects Files .
1.4.2
.
.
Parameter Files .
.
. .
. .
. .
. .
. .
. .
. .
. .
. .
. .
. .
. .
. .
. .
. .
. .
1.5 Data Set .
. .
. .
. .
. .
.
.
.
.
.
.
.
.
.
.
.
.
.
.
.
.
.
.
.
.
.
.
.
.
.
.
.
.
.
.
.
.
.
.
.
. .
.
. .
.
. .
.
2 Estimation Algorithms
2.1 Common Parameters
2.2 Kriging .
. .
Indicator Kriging . .
2.3
. .
2.4 CoKriging .
. .
. .
.
.
.
.
.
.
.
.
.
.
.
. .
. .
. .
. .
.
.
.
.
. .
. .
. .
. .
3 Simulation Algorithms
3.1 Common Simulation Parameters .
. .
3.2 SGSIM .
.
3.3 SISIM .
.
. .
.
. .
3.4 COSGSIM .
. .
. .
. .
. .
. .
. .
. .
. .
. .
.
.
.
.
.
.
.
.
.
.
.
.
.
.
.
.
.
.
.
.
. .
. .
. .
. .
. .
. .
. .
. .
.
.
.
.
.
.
.
.
. .
. .
. .
. .
. .
. .
. .
. .
.
.
.
.
.
.
.
.
.
.
.
.
.
.
.
.
. .
. .
. .
. .
. .
. .
. .
. .
.
.
.
.
.
.
.
.
2
.
.
.
.
.
.
.
.
.
.
.
.
.
.
.
.
.
.
.
.
.
.
.
.
.
.
.
.
.
.
.
.
.
.
.
.
. .
. .
. .
. .
. .
. .
. .
. .
. .
. .
. .
. .
. .
. .
. .
. .
. .
. .
.
.
.
.
.
.
.
.
.
.
.
.
.
.
.
.
.
.
. .
. .
. .
. .
. .
. .
. .
. .
. .
. .
. .
. .
. .
. .
. .
. .
. .
. .
.
.
.
.
.
.
.
.
.
.
.
.
.
.
.
.
.
.
.
.
.
.
.
.
.
.
.
.
.
.
.
.
.
.
.
.
4
4
. .
4
. .
. .
6
. . 11
. . 12
. . 15
. . 18
. . 18
. . 19
. . 21
24
. . 24
. . 25
. . 26
. . 31
35
. . 36
. . 36
. . 44
. . 54
�
CONTENTS
3
3.5 COSISIM .
.
3.6 SNESIM .
. .
. .
.
.
. .
. .
.
.
.
.
. .
. .
.
.
. .
. .
.
.
.
.
. .
. .
.
.
. .
. .
.
.
.
.
. .
. .
.
.
.
.
. .
. .
.
.
. .
. .
.
.
.
.
. . 61
. . 69
�
Section 1
General Overview
GEMS, the Geostatistical Earth Modeling Software, is an example of software built from
scratch using the GsTL. The source code of GEMS serves as an example of how to use
GsTL facilities.
GEMS was designed with two aims in mind. The first one, geared toward the end-
user, is to provide a user-friendly software which offers a large range of geostatistics tools:
the most common geostatistics algorithms are implemented, in addition to more recent
developments such as multiple-point statistics simulation. The user-friendliness of GEMS
mainly comes from its non-obtrusive graphical user interface, and the possibility to directly
visualize data sets and results in a full 3-D interactive environment. The second objective
was to design a software whose functionalities could conveniently be augmented. New fea-
tures can be added into GEMS through a system of plug-ins, i.e. pieces of software which
can not be run by themselves but complement a main software. In GEMS, plug-ins can
be used to add new (geostatistics) tools, add new grid data structures (faulted stratigraphic
grids for example) or define new import/export filters.
1.1 First Steps with GEMS
1.1.1 A quick tour to the graphical user interface
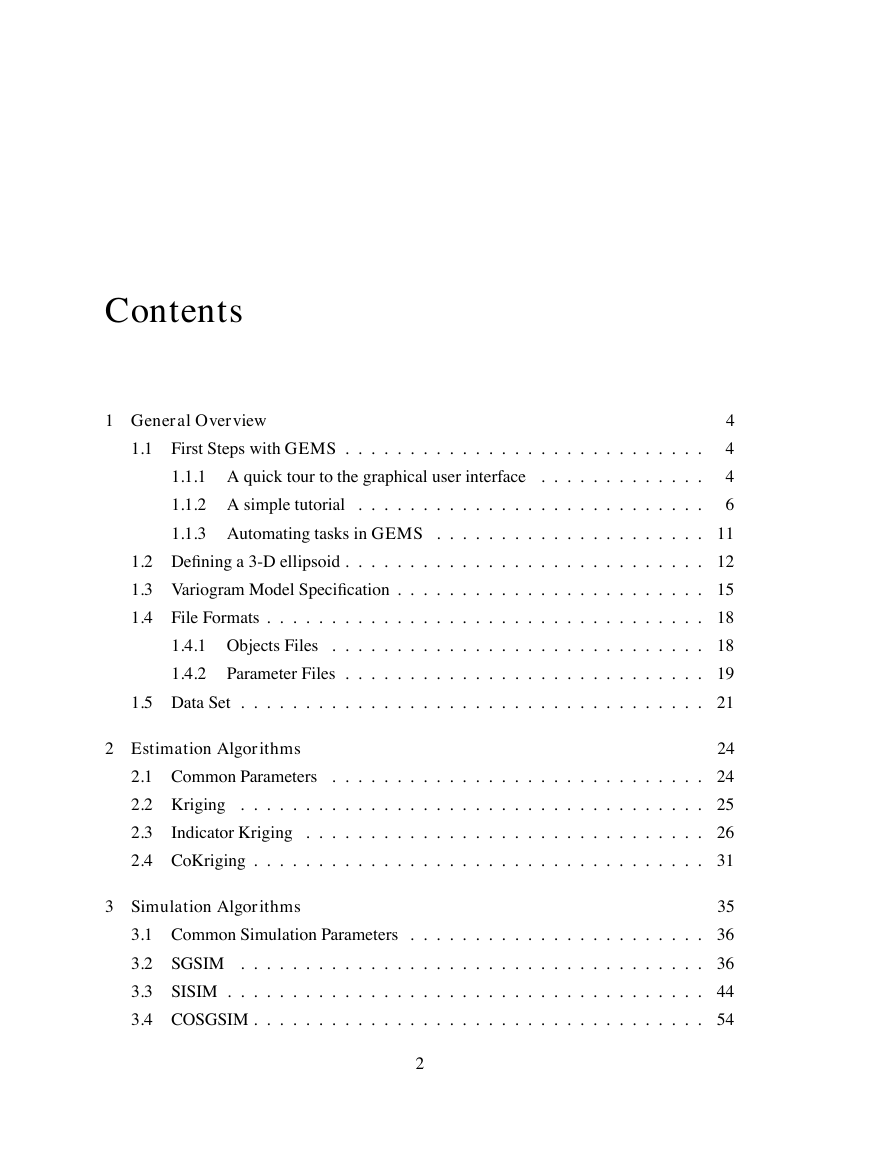
The graphical user interface (GUI) of GEMS is divided into 3 main parts, see Fig. 1.1:
4
�
1.1. FIRSTSTEPSWITHGEMS
5
Figure 1.1: GEMS’s graphical interface. The three main panels are highlighted in red. The
top-right panel is the Algorithm Panel, the top-left is the Visualization Panel and the bottom
is the Command Panel
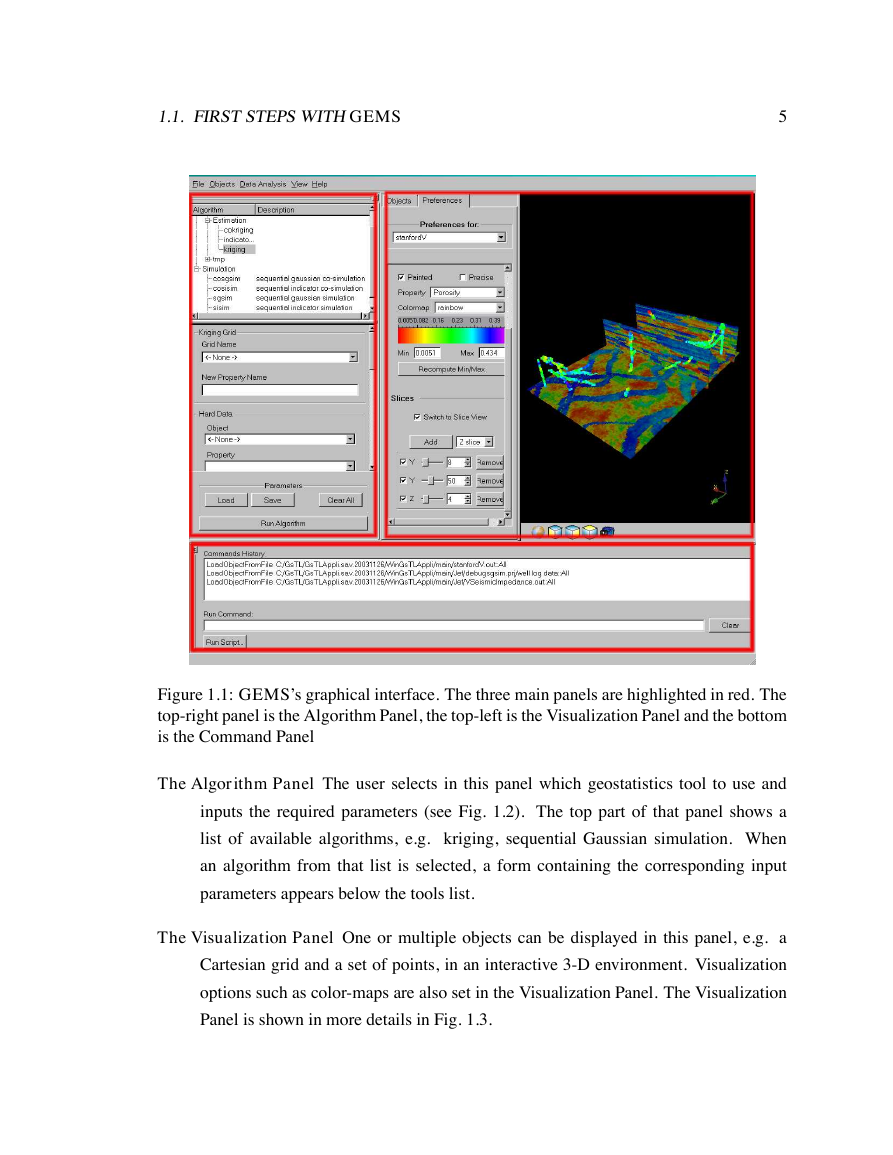
The Algorithm Panel The user selects in this panel which geostatistics tool to use and
inputs the required parameters (see Fig. 1.2). The top part of that panel shows a
list of available algorithms, e.g. kriging, sequential Gaussian simulation. When
an algorithm from that list is selected, a form containing the corresponding input
parameters appears below the tools list.
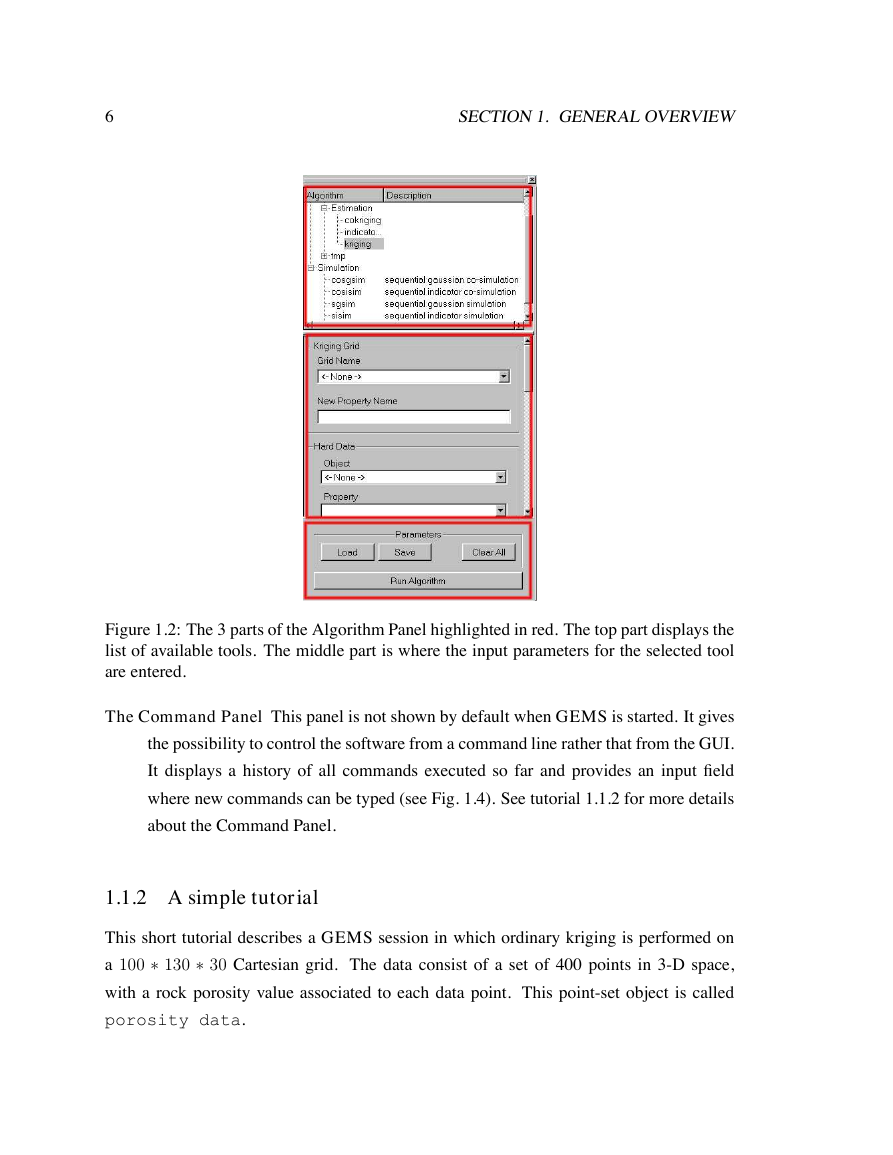
The Visualization Panel One or multiple objects can be displayed in this panel, e.g. a
Cartesian grid and a set of points, in an interactive 3-D environment. Visualization
options such as color-maps are also set in the Visualization Panel. The Visualization
Panel is shown in more details in Fig. 1.3.
�
6
SECTION1. GENERALOVERVIEW
Figure 1.2: The 3 parts of the Algorithm Panel highlighted in red. The top part displays the
list of available tools. The middle part is where the input parameters for the selected tool
are entered.
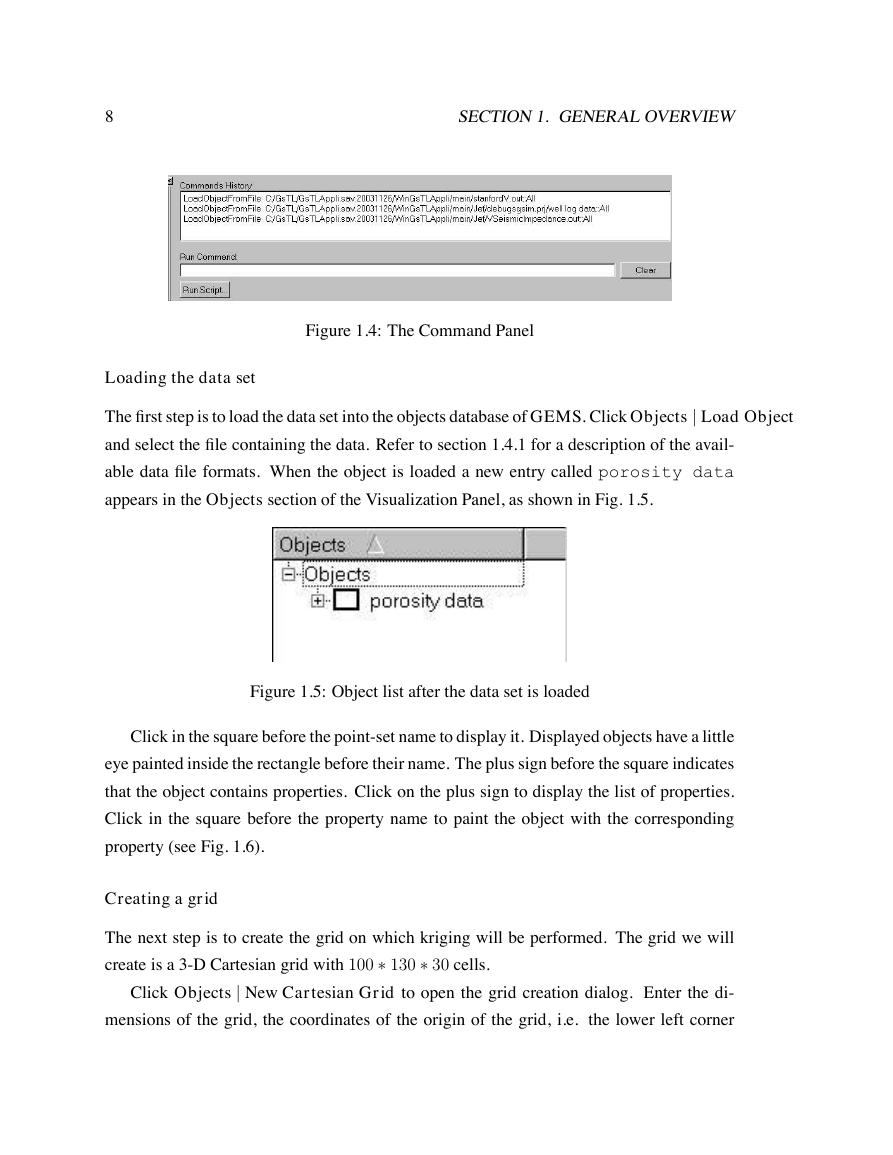
The Command Panel This panel is not shown by default when GEMS is started. It gives
the possibility to control the software from a command line rather that from the GUI.
It displays a history of all commands executed so far and provides an input field
where new commands can be typed (see Fig. 1.4). See tutorial 1.1.2 for more details
about the Command Panel.
1.1.2 A simple tutorial
This short tutorial describes a GEMS session in which ordinary kriging is performed on
a 100 130 30 Cartesian grid. The data consist of a set of 400 points in 3-D space,
with a rock porosity value associated to each data point. This point-set object is called
porosity data.
�
1.1. FIRSTSTEPSWITHGEMS
7
Figure 1.3: The Visualization Panel. The left-hand side (highlighted in red) controls which
objects (e.g. grids) are visible. It is also used to set display options, such as which color-
map to use.
The steps involved are the following:
1. Load the data set
2. Create a Cartesian grid
3. Select the kriging tool and enter the necessary parameters
4. Display and save the result
�
8
SECTION1. GENERALOVERVIEW
Figure 1.4: The Command Panel
Loading the data set
The first step is to load the data set into the objects database of GEMS. Click Objects j Load Object
and select the file containing the data. Refer to section 1.4.1 for a description of the avail-
able data file formats. When the object is loaded a new entry called porosity data
appears in the Objects section of the Visualization Panel, as shown in Fig. 1.5.
Figure 1.5: Object list after the data set is loaded
Click in the square before the point-set name to display it. Displayed objects have a little
eye painted inside the rectangle before their name. The plus sign before the square indicates
that the object contains properties. Click on the plus sign to display the list of properties.
Click in the square before the property name to paint the object with the corresponding
property (see Fig. 1.6).
Creating a grid
The next step is to create the grid on which kriging will be performed. The grid we will
create is a 3-D Cartesian grid with 100 130 30 cells.
Click Objects j New Cartesian Grid to open the grid creation dialog. Enter the di-
the lower left corner
mensions of the grid, the coordinates of the origin of the grid, i.e.
�





 2023年江西萍乡中考道德与法治真题及答案.doc
 2012年重庆南川中考生物真题及答案.doc
 2013年江西师范大学地理学综合及文艺理论基础考研真题.doc
 2020年四川甘孜小升初语文真题及答案I卷.doc
 2020年注册岩土工程师专业基础考试真题及答案.doc
 2023-2024学年福建省厦门市九年级上学期数学月考试题及答案.doc
 2021-2022学年辽宁省沈阳市大东区九年级上学期语文期末试题及答案.doc
 2022-2023学年北京东城区初三第一学期物理期末试卷及答案.doc
 2018上半年江西教师资格初中地理学科知识与教学能力真题及答案.doc
 2012年河北国家公务员申论考试真题及答案-省级.doc
 2020-2021学年江苏省扬州市江都区邵樊片九年级上学期数学第一次质量检测试题及答案.doc
 2022下半年黑龙江教师资格证中学综合素质真题及答案.doc