�
Say It With Charts
Workbook
GENE ZELAZNY
Edited by Steve Sakson
McGraw-Hill
New York Chicago San Francisco Lisbon London
Madrid Mexico City Milan New Delhi San Juan
Seoul Singapore Sydney Toronto
Copyright © 2005 by Gene Zelazny. All rights reserved. Manufactured in the United States of America.
Except as permitted under the United States Copyright Act of 1976, no part of this publication may be
reproduced or distributed in any form or by any means, or stored in a database or retrieval system, without
the prior written permission of the publisher.
0-07-145493-4
The material in this eBook also appears in the print version of this title: 0-07-144162-X
All trademarks are trademarks of their respective owners. Rather than put a trademark symbol after every
occurrence of a trademarked name, we use names in an editorial fashion only, and to the benefit of the
trademark owner, with no intention of infringement of the trademark. Where such designations appear in
this book, they have been printed with initial caps. McGraw-Hill eBooks are available at special quantity
discounts to use as premiums and sales promotions, or for use in corporate training programs. For more
information, please contact George Hoare, Special Sales, at george_hoare@mcgraw-hill.com or (212) 904-
4069.
TERMS OF USE
This is a copyrighted work and The McGraw-Hill Companies, Inc. (“McGraw-Hill”) and its licensors
reserve all rights in and to the work. Use of this work is subject to these terms. Except as permitted under
the Copyright Act of 1976 and the right to store and retrieve one copy of the work, you may not decompile,
disassemble, reverse engineer, reproduce, modify, create derivative works based upon, transmit, distribute,
disseminate, sell, publish or sublicense the work or any part of it without McGraw -Hill’s prior consent.
You may use the work for your own noncommercial and personal use; any other use of the work is strictly
prohibited. Your right to use the work may be terminated if you fail to comply with these terms.
THE WORK
ITS LICENSORS MAKE NO
GUARANTEES OR WARRANTIES AS TO THE ACCURACY, ADEQUACY OR COMPLETENESS OF
OR RESULTS TO BE OBTAINED FROM USING THE WORK, INCLUDING ANY INFORMATION
THAT CAN BE ACCESSED THROUGH THE WORK VIA HYPERLINK OR OTHERWISE, AND
EXPRESSLY DISCLAIM ANY WARRANTY, EXPRESS OR
INCLUDING BUT NOT
LIMITED TO
IMPLIED WARRANTIES OF MERCHANTABILITY OR FITNESS FOR A
PARTICULAR PURPOSE. McGraw-Hill and its licensors do not warrant or guarantee that the functions
contained in the work will meet your requirements or that its operation will be uninterrupted or error free.
Neither McGraw- Hill nor its licensors shall be liable to you or anyone else for any inaccuracy, error or
omission, regardless of cause, in the work or for any damages resulting therefrom. McGraw-Hill has no
responsibility for the content of any information accessed through the work. Under no circumstances shall
McGraw- Hill and/or its licensors be liable for any indirect, incidental, special, punitive, consequential or
similar damages that result from the use of or inability to use the work, even if any of them has been advised
of the possibility of such damages. This limitation of liability shall apply to any claim or cause whatsoever
whether such claim or cause arises in contract, tort or otherwise.
DOI: 10.1036/0071454934
IS.” McGRAW-HILL AND
IS PROVIDED “AS
IMPLIED,
�
For more information about this title, click here
Contents
SAY IT WITH CHARTS WORKBOOK
NOW IT’S YOUR TURN TO SAY IT
WITH CHARTS
CERTIFICATE OF COMPLETION
INDEX
1
15
120
122
iii
�
This page intentionally left blank.
�
Say It With Charts
WorkBook
Introduction
In my book Say It with Charts, I lay out some easy techniques
that business people can use to create visual presentations that
are powerful, persuasive, and eye-catching. However, if you’re
like many who face the challenge of mastering this skill, you
know it takes time, patience, and, most of all, practice, practice,
and more practice. That's why I offer you this workbook.
In it, you'll find three things:
• A series of business charts that I've gathered from
real-life situations
• A challenge to you to improve them
• Suggested improvements to communicate
the information more quickly and clearly.
Your challenge in this workbook is to avoid the temptation
of simply flipping the page to see my solution. Instead, I
encourage you to study the charts and use the space you'll find
below them to sketch your ideas for improvement. Then, turn
Copyright © 2005 by Gene Zelazny. Click here for terms of use.
1
�
the page to compare your ideas with what I came up with in
the real world and what led to my thinking.
As you accept this challenge, understand that I am in no way
claiming that my answer is the best one. In fact, I have every
confidence that your answer could work just as well. The
important thing is that you take a critical look to determine
what the level of improvement can be.
Also, understand that there's nothing requiring you to do these
exercises sequentially. Start anywhere. Dip in and out. Come
back to the same example again as new ideas come up. I hope
that after you've done a few of these you'll conclude that "playing
it with charts" can actually be fun.
Before you start, let me offer this quick refresher on the
fundamentals of charts. As readers of Say It with Charts
will remember, charts generally fall into two broad categories:
• Data charts, also called quantitative charts, depict
numbers graphically to make a point.
• Concept charts, also called nonquantitative charts,
use words and images.
Of course, some charts use elements of both categories.
2
�
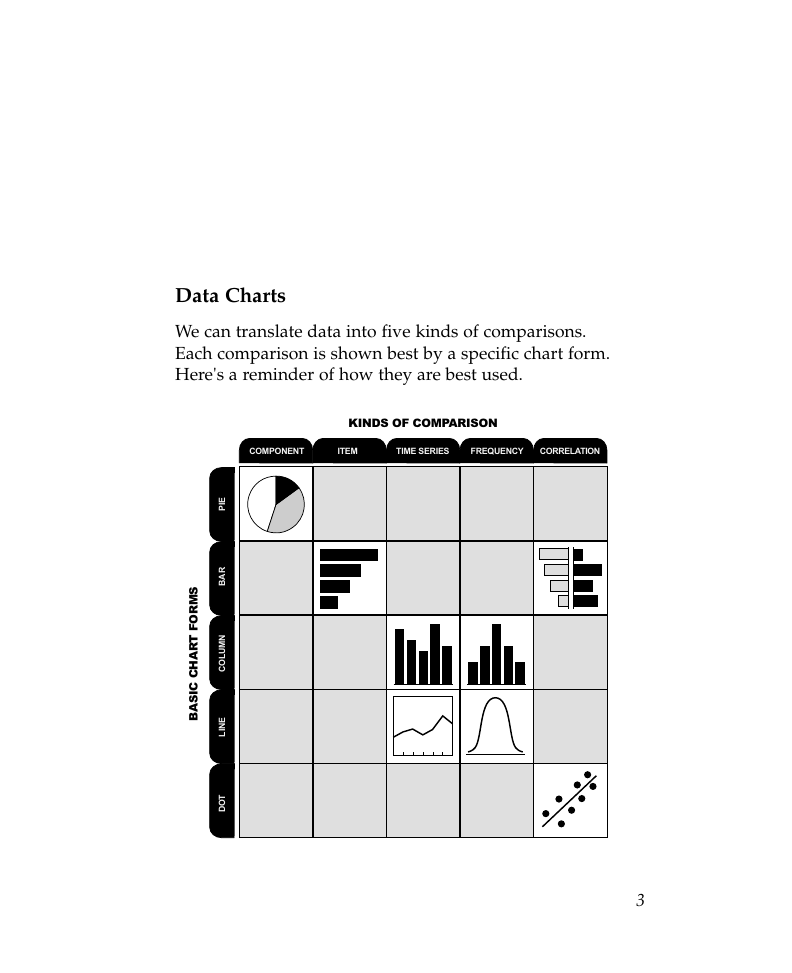
Data Charts
We can translate data into five kinds of comparisons.
Each comparison is shown best by a specific chart form.
Here's a reminder of how they are best used.
KINDS OF COMPARISON
COMPONENT
ITEM
TIME SERIES
FREQUENCY
CORRELATION
S
M
R
O
F
T
R
A
H
C
C
I
S
A
B
E
P
I
R
A
B
N
M
U
L
O
C
E
N
L
I
T
O
D
3
�





 2023年江西萍乡中考道德与法治真题及答案.doc
 2012年重庆南川中考生物真题及答案.doc
 2013年江西师范大学地理学综合及文艺理论基础考研真题.doc
 2020年四川甘孜小升初语文真题及答案I卷.doc
 2020年注册岩土工程师专业基础考试真题及答案.doc
 2023-2024学年福建省厦门市九年级上学期数学月考试题及答案.doc
 2021-2022学年辽宁省沈阳市大东区九年级上学期语文期末试题及答案.doc
 2022-2023学年北京东城区初三第一学期物理期末试卷及答案.doc
 2018上半年江西教师资格初中地理学科知识与教学能力真题及答案.doc
 2012年河北国家公务员申论考试真题及答案-省级.doc
 2020-2021学年江苏省扬州市江都区邵樊片九年级上学期数学第一次质量检测试题及答案.doc
 2022下半年黑龙江教师资格证中学综合素质真题及答案.doc