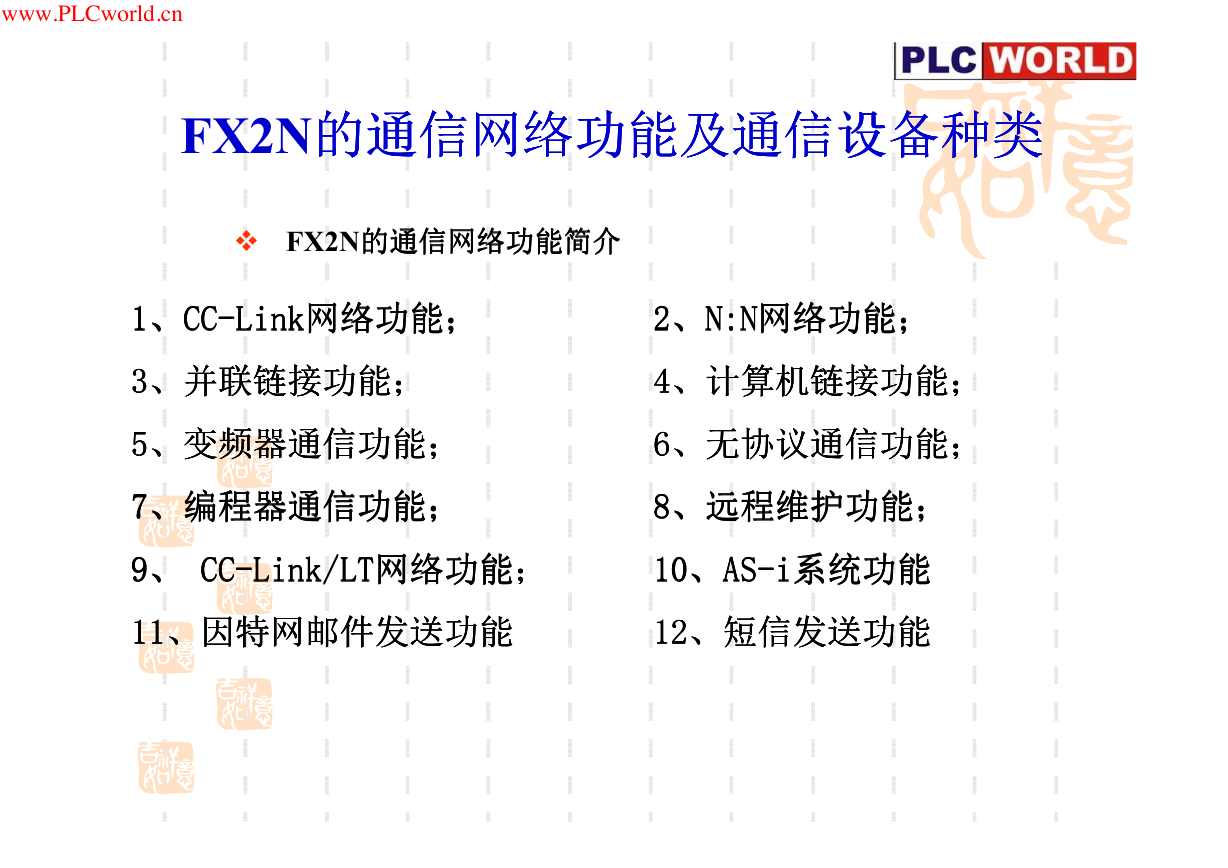
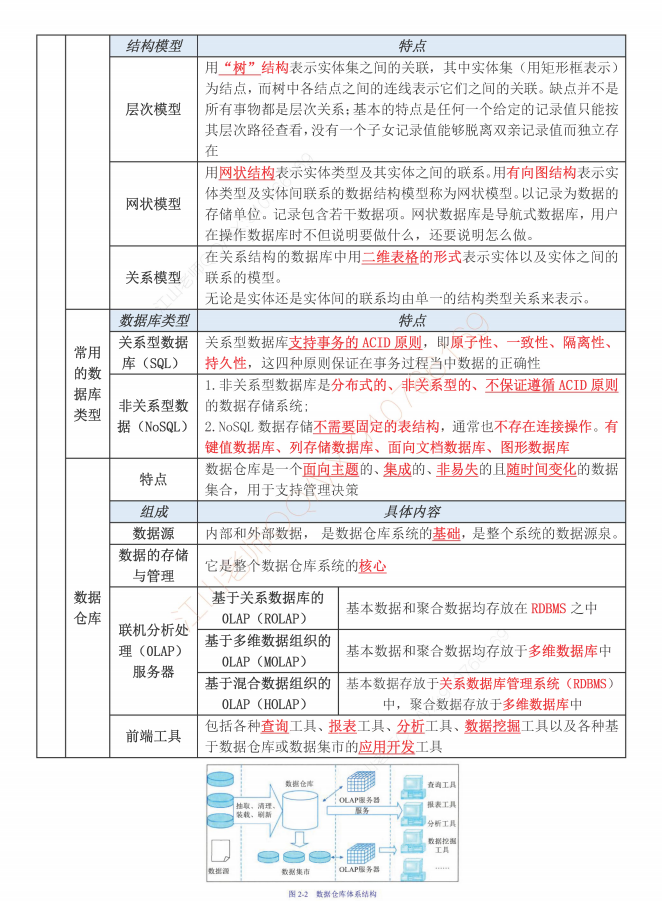
Note: The following table appears in the printed Annual Report on the facing page of the Chairman's Letter
and is referred to in that letter.
Berkshire’s Corporate Performance vs. the S&P 500
Annual Percentage Change
in S&P 500
in Per-Share
Book Value of with Dividends
Berkshire
Included
Year
1965
1966
1967
1968
1969
1970
1971
1972
1973
1974
1975
1976
1977
1978
1979
1980
1981
1982
1983
1984
1985
1986
1987
1988
1989
1990
1991
1992
1993
1994
1995
1996
1997
1998
1999
2000
2001
2002
2003
2004
2005
2006
..................................................
..................................................
..................................................
..................................................
..................................................
..................................................
..................................................
..................................................
..................................................
..................................................
..................................................
..................................................
..................................................
..................................................
..................................................
..................................................
..................................................
..................................................
..................................................
..................................................
..................................................
..................................................
..................................................
..................................................
..................................................
..................................................
..................................................
..................................................
..................................................
..................................................
..................................................
..................................................
..................................................
..................................................
..................................................
..................................................
..................................................
..................................................
..................................................
..................................................
..................................................
..................................................
(1)
23.8
20.3
11.0
19.0
16.2
12.0
16.4
21.7
4.7
5.5
21.9
59.3
31.9
24.0
35.7
19.3
31.4
40.0
32.3
13.6
48.2
26.1
19.5
20.1
44.4
7.4
39.6
20.3
14.3
13.9
43.1
31.8
34.1
48.3
.5
6.5
(6.2)
10.0
21.0
10.5
6.4
18.4
Relative
Results
(1)-(2)
13.8
32.0
(19.9)
8.0
24.6
8.1
1.8
2.8
19.5
31.9
(15.3)
35.7
39.3
17.6
17.5
(13.0)
36.4
18.6
9.9
7.5
16.6
7.5
14.4
3.5
12.7
10.5
9.1
12.7
4.2
12.6
5.5
8.8
.7
19.7
(20.5)
15.6
5.7
32.1
(7.7)
(.4)
1.5
2.6
(2)
10.0
(11.7)
30.9
11.0
(8.4)
3.9
14.6
18.9
(14.8)
(26.4)
37.2
23.6
(7.4)
6.4
18.2
32.3
(5.0)
21.4
22.4
6.1
31.6
18.6
5.1
16.6
31.7
(3.1)
30.5
7.6
10.1
1.3
37.6
23.0
33.4
28.6
21.0
(9.1)
(11.9)
(22.1)
28.7
10.9
4.9
15.8
Compounded Annual Gain – 1965-2006
Overall Gain – 1964-2006
21.4%
361,156%
10.4%
6,479%
11.0
Notes: Data are for calendar years with these exceptions: 1965 and 1966, year ended 9/30; 1967, 15 months ended 12/31.
Starting in 1979, accounting rules required insurance companies to value the equity securities they hold at market
rather than at the lower of cost or market, which was previously the requirement. In this table, Berkshire’s results
through 1978 have been restated to conform to the changed rules. In all other respects, the results are calculated using
the numbers originally reported.
The S&P 500 numbers are pre-tax whereas the Berkshire numbers are after-tax. If a corporation such as Berkshire
were simply to have owned the S&P 500 and accrued the appropriate taxes, its results would have lagged the S&P 500
in years when that index showed a positive return, but would have exceeded the S&P 500 in years when the index
showed a negative return. Over the years, the tax costs would have caused the aggregate lag to be substantial.
2
�
BERKSHIRE HATHAWAY INC.
To the Shareholders of Berkshire Hathaway Inc.:
Our gain in net worth during 2006 was $16.9 billion, which increased the per-share book value of
both our Class A and Class B stock by 18.4%. Over the last 42 years (that is, since present management
took over) book value has grown from $19 to $70,281, a rate of 21.4% compounded annually.*
We believe that $16.9 billion is a record for a one-year gain in net worth – more than has ever
been booked by any American business, leaving aside boosts that have occurred because of mergers (e.g.,
AOL’s purchase of Time Warner). Of course, Exxon Mobil and other companies earn far more than
Berkshire, but their earnings largely go to dividends and/or repurchases, rather than to building net worth.
All that said, a confession about our 2006 gain is in order. Our most important business,
insurance, benefited from a large dose of luck: Mother Nature, bless her heart, went on vacation. After
hammering us with hurricanes in 2004 and 2005 – storms that caused us to lose a bundle on super-cat
insurance – she just vanished. Last year, the red ink from this activity turned black – very black.
In addition, the great majority of our 73 businesses did outstandingly well in 2006. Let me focus
for a moment on one of our largest operations, GEICO. What management accomplished there was simply
extraordinary.
As I’ve told you before, Tony Nicely, GEICO’s CEO, went to work at the company 45 years ago,
two months after turning 18. He became CEO in 1992, and from then on the company’s growth exploded.
In addition, Tony has delivered staggering productivity gains in recent years. Between yearend 2003 and
yearend 2006, the number of GEICO policies increased from 5.7 million to 8.1 million, a jump of 42%.
Yet during that same period, the company’s employees (measured on a fulltime-equivalent basis) fell 3.5%.
So productivity grew 47%. And GEICO didn’t start fat.
That remarkable gain has allowed GEICO to maintain its all-important position as a low-cost
producer, even though it has dramatically increased advertising expenditures. Last year GEICO spent $631
million on ads, up from $238 million in 2003 (and up from $31 million in 1995, when Berkshire took
control). Today, GEICO spends far more on ads than any of its competitors, even those much larger. We
will continue to raise the bar.
Last year I told you that if you had a new son or grandson to be sure to name him Tony. But Don
Keough, a Berkshire director, recently had a better idea. After reviewing GEICO’s performance in 2006,
he wrote me, “Forget births. Tell the shareholders to immediately change the names of their present
children to Tony or Antoinette.” Don signed his letter “Tony.”
* * * * * * * * * * * *
Charlie Munger – my partner and Berkshire’s vice chairman – and I run what has turned out to be
a big business, one with 217,000 employees and annual revenues approaching $100 billion. We certainly
didn’t plan it that way. Charlie began as a lawyer, and I thought of myself as a security analyst. Sitting in
those seats, we both grew skeptical about the ability of big entities of any type to function well. Size seems
to make many organizations slow-thinking, resistant to change and smug. In Churchill’s words: “We shape
our buildings, and afterwards our buildings shape us.” Here’s a telling fact: Of the ten non-oil companies
having the largest market capitalization in 1965 – titans such as General Motors, Sears, DuPont and
Eastman Kodak – only one made the 2006 list.
are 1/30th of those shown for the A.
*All per-share figures used in this report apply to Berkshire’s A shares. Figures for the B shares
3
�
In fairness, we’ve seen plenty of successes as well, some truly outstanding. There are many giant-
company managers whom I greatly admire; Ken Chenault of American Express, Jeff Immelt of G.E. and
Dick Kovacevich of Wells Fargo come quickly to mind. But I don’t think I could do the management job
they do. And I know I wouldn’t enjoy many of the duties that come with their positions – meetings,
speeches, foreign travel, the charity circuit and governmental relations. For me, Ronald Reagan had it
right: “It’s probably true that hard work never killed anyone – but why take the chance?”
So I’ve taken the easy route, just sitting back and working through great managers who run their
own shows. My only tasks are to cheer them on, sculpt and harden our corporate culture, and make major
capital-allocation decisions. Our managers have returned this trust by working hard and effectively.
For their performance over the last 42 years – and particularly for 2006 – Charlie and I thank
them.
Yardsticks
Charlie and I measure Berkshire’s progress and evaluate its intrinsic value in a number of ways.
No single criterion is effective in doing these jobs, and even an avalanche of statistics will not capture some
factors that are important. For example, it’s essential that we have managers much younger than I available
to succeed me. Berkshire has never been in better shape in this regard – but I can’t prove it to you with
numbers.
There are two statistics, however, that are of real importance. The first is the amount of
investments (including cash and cash-equivalents) that we own on a per-share basis. Arriving at this figure,
we exclude investments held in our finance operation because these are largely offset by borrowings.
Here’s the record since present management acquired control of Berkshire:
Per-Share Investments*
Year
1965 .....................................................................
1975 .....................................................................
1985 .....................................................................
1995 .....................................................................
2006 .....................................................................
Compound Growth Rate 1965-2006....................
Compound Growth Rate 1995-2006....................
*Net of minority interests
$ 4
159
2,407
21,817
$80,636
27.5%
12.6%
In our early years we put most of our retained earnings and insurance float into investments in
marketable securities. Because of this emphasis, and because the securities we purchased generally did
well, our growth rate in investments was for a long time quite high.
Over the years, however, we have focused more and more on the acquisition of operating
businesses. Using our funds for these purchases has both slowed our growth in investments and accelerated
our gains in pre-tax earnings from non-insurance businesses, the second yardstick we use. Here’s how
those earnings have looked:
4
�
Pre-Tax Earnings Per Share*
Year
1965 .....................................................................
$ 4
1975 .....................................................................
4
1985 .....................................................................
52
1995 .....................................................................
175
2006 .....................................................................
$3,625
Compound Growth Rate 1965-2006 ....................
17.9%
Compound Growth Rate 1995-2006 ....................
31.7%
*Excluding purchase-accounting adjustments and net of minority interests
Last year we had a good increase in non-insurance earnings – 38%. Large gains from here on in,
though, will come only if we are able to make major, and sensible, acquisitions. That will not be easy. We
do, however, have one advantage: More and more, Berkshire has become “the buyer of choice” for
business owners and managers. Initially, we were viewed that way only in the U.S. (and more often than
not by private companies). We’ve long wanted, nonetheless, to extend Berkshire’s appeal beyond U.S.
borders. And last year, our globe-trotting finally got underway.
Acquisitions
billion for PacifiCorp, Business Wire and Applied Underwriters. All are performing very well.
The highlight of the year, however, was our July 5th acquisition of most of ISCAR, an Israeli
company, and our new association with its chairman, Eitan Wertheimer, and CEO, Jacob Harpaz. The
story here began on October 25, 2005, when I received a 1¼-page letter from Eitan, of whom I then knew
nothing. The letter began, “I am writing to introduce you to ISCAR,” and proceeded to describe a cutting-
tool business carried on in 61 countries. Then Eitan wrote, “We have for some time considered the issues
of generational transfer and ownership that are typical for large family enterprises, and have given much
thought to ISCAR’s future. Our conclusion is that Berkshire Hathaway would be the ideal home for
ISCAR. We believe that ISCAR would continue to thrive as a part of your portfolio of businesses.”
We began 2006 by completing the three acquisitions pending at yearend 2005, spending about $6
Overall, Eitan’s letter made the quality of the company and the character of its management leap
off the page. It also made me want to learn more, and in November, Eitan, Jacob and ISCAR’s CFO,
Danny Goldman, came to Omaha. A few hours with them convinced me that if we were to make a deal, we
would be teaming up with extraordinarily talented managers who could be trusted to run the business after
a sale with all of the energy and dedication that they had exhibited previously. However, having never
bought a business based outside of the U.S. (though I had bought a number of foreign stocks), I needed to
get educated on some tax and jurisdictional matters. With that task completed, Berkshire purchased 80% of
ISCAR for $4 billion. The remaining 20% stays in the hands of the Wertheimer family, making it our
valued partner.
ISCAR’s products are small, consumable cutting tools that are used in conjunction with large and
expensive machine tools. It’s a business without magic except for that imparted by the people who run it.
But Eitan, Jacob and their associates are true managerial magicians who constantly develop tools that make
their customers’ machines more productive. The result: ISCAR makes money because it enables its
customers to make more money. There is no better recipe for continued success.
5
�
In September, Charlie and I, along with five Berkshire associates, visited ISCAR in Israel. We –
and I mean every one of us – have never been more impressed with any operation. At ISCAR, as
throughout Israel, brains and energy are ubiquitous. Berkshire shareholders are lucky to have joined with
Eitan, Jacob, Danny and their talented associates.
* * * * * * * * * * * *
A few months later, Berkshire again became “the buyer of choice” in a deal brought to us by my
friend, John Roach, of Fort Worth. John, many of you will remember, was Chairman of Justin Industries,
which we bought in 2000. At that time John was helping John Justin, who was terminally ill, find a
permanent home for his company. John Justin died soon after we bought Justin Industries, but it has since
been run exactly as we promised him it would be.
Visiting me in November, John Roach brought along Paul Andrews, Jr., owner of about 80% of
TTI, a Fort Worth distributor of electronic components. Over a 35-year period, Paul built TTI from
$112,000 of sales to $1.3 billion. He is a remarkable entrepreneur and operator.
Paul, 64, loves running his business. But not long ago he happened to witness how disruptive the
death of a founder can be both to a private company’s employees and the owner’s family. What starts out
as disruptive, furthermore, often evolves into destructive. About a year ago, therefore, Paul began to think
about selling TTI. His goal was to put his business in the hands of an owner he had carefully chosen, rather
than allowing a trust officer or lawyer to conduct an auction after his death.
Paul rejected the idea of a “strategic” buyer, knowing that in the pursuit of “synergies,” an owner
of that type would be apt to dismantle what he had so carefully built, a move that would uproot hundreds of
his associates (and perhaps wound TTI’s business in the process). He also ruled out a private equity firm,
which would very likely load the company with debt and then flip it as soon as possible.
That left Berkshire. Paul and I met on the morning of November 15th and made a deal before
lunch. Later he wrote me: “After our meeting, I am confident that Berkshire is the right owner for TTI . . .
I am proud of our past and excited about our future.” And so are Charlie and I.
* * * * * * * * * * * *
We also made some “tuck-in” acquisitions during 2006 at Fruit of the Loom (“Fruit”), MiTek,
CTB, Shaw and Clayton. Fruit made the largest purchases. First, it bought Russell Corp., a leading
producer of athletic apparel and uniforms for about $1.2 billion (including assumed debt) and in December
it agreed to buy the intimate apparel business of VF Corp. Together, these acquisitions add about $2.2
billion to Fruit’s sales and bring with them about 23,000 employees.
Charlie and I love it when we can acquire businesses that can be placed under managers, such as
John Holland at Fruit, who have already shown their stuff at Berkshire. MiTek, for example, has made 14
acquisitions since we purchased it in 2001, and Gene Toombs has delivered results from these deals far in
excess of what he had predicted. In effect, we leverage the managerial talent already with us by these tuck-
in deals. We will make many more.
* * * * * * * * * * * *
We continue, however, to need “elephants” in order for us to use Berkshire’s flood of incoming
cash. Charlie and I must therefore ignore the pursuit of mice and focus our acquisition efforts on much
bigger game.
Our exemplar is the older man who crashed his grocery cart into that of a much younger fellow
while both were shopping. The elderly man explained apologetically that he had lost track of his wife and
was preoccupied searching for her. His new acquaintance said that by coincidence his wife had also
wandered off and suggested that it might be more efficient if they jointly looked for the two women.
Agreeing, the older man asked his new companion what his wife looked like. “She’s a gorgeous blonde,”
the fellow answered, “with a body that would cause a bishop to go through a stained glass window, and
she’s wearing tight white shorts. How about yours?” The senior citizen wasted no words: “Forget her,
we’ll look for yours.”
6
�
What we are looking for is described on page 25. If you have an acquisition candidate that fits,
call me – day or night. And then watch me shatter a stained glass window.
* * * * * * * * * * * *
Now, let’s examine the four major operating sectors of Berkshire. Lumping their financial figures
together impedes analysis. So we’ll look at them as four separate businesses, starting with the all–
important insurance group.
Insurance
Next month marks the 40th anniversary of our entrance into the insurance business. It was on
March 9, 1967, that Berkshire purchased National Indemnity and its companion company, National Fire &
Marine, from Jack Ringwalt for $8.6 million.
Jack was a long-time friend of mine and an excellent, but somewhat eccentric, businessman. For
about ten minutes every year he would get the urge to sell his company. But those moods – perhaps
brought on by a tiff with regulators or an unfavorable jury verdict – quickly vanished.
In the mid-1960s, I asked investment banker Charlie Heider, a mutual friend of mine and Jack’s,
to alert me the next time Jack was “in heat.” When Charlie’s call came, I sped to meet Jack. We made a
deal in a few minutes, with me waiving an audit, “due diligence” or anything else that would give Jack an
opportunity to reconsider. We just shook hands, and that was that.
When we were due to close the purchase at Charlie’s office, Jack was late. Finally arriving, he
explained that he had been driving around looking for a parking meter with some unexpired time. That was
a magic moment for me. I knew then that Jack was going to be my kind of manager.
When Berkshire purchased Jack’s two insurers, they had “float” of $17 million. We’ve regularly
offered a long explanation of float in earlier reports, which you can read on our website. Simply put, float
is money we hold that is not ours but which we get to invest.
At the end of 2006, our float had grown to $50.9 billion, and we have since written a huge
retroactive reinsurance contract with Equitas – which I will describe in the next section – that boosts float
by another $7 billion. Much of the gain we’ve made has come through our acquisition of other insurers,
but we’ve also had outstanding internal growth, particularly at Ajit Jain’s amazing reinsurance operation.
Naturally, I had no notion in 1967 that our float would develop as it has. There’s much to be said for just
putting one foot in front of the other every day.
The float from retroactive reinsurance contracts, of which we have many, automatically drifts
down over time. Therefore, it will be difficult for us to increase float in the future unless we make new
acquisitions in the insurance field. Whatever its size, however, the all-important cost of Berkshire’s float
over time is likely to be significantly below that of the industry, perhaps even falling to less than zero.
Note the words “over time.” There will be bad years periodically. You can be sure of that.
In 2006, though, everything went right in insurance – really right. Our managers – Tony Nicely
(GEICO), Ajit Jain (B-H Reinsurance), Joe Brandon and Tad Montross (General Re), Don Wurster
(National Indemnity Primary), Tom Nerney (U.S. Liability), Tim Kenesey (Medical Protective), Rod
Eldred (Homestate Companies and Cypress), Sid Ferenc and Steve Menzies (Applied Underwriters), John
Kizer (Central States) and Don Towle (Kansas Bankers Surety) – simply shot the lights out. When I recite
their names, I feel as if I’m at Cooperstown, reading from the Hall of Fame roster. Of course, the overall
insurance industry also had a terrific year in 2006. But our managers delivered results generally superior to
those of their competitors.
7
�
(in $ millions)
Underwriting Profit (Loss)
2005
2006
Insurance Operations
$ 526
General Re .......................
1,658
B-H Reinsurance..............
1,314
GEICO .............................
Other Primary...................
340**
Total.................................
$3,838
* Includes MedPro from June 30, 2005.
** Includes Applied Underwriters from May 19, 2006.
* * * * * * * * * * * *
$( 334)
(1,069)
1,221
235*
$ 53
Yearend Float
2005
2006
$22,827
16,860
7,171
4,029
$50,887
$22,920
16,233
6,692
3,442
$49,287
Below is the tally on our underwriting and float for each major sector of insurance. Enjoy the
view, because you won’t soon see another like it.
In 2007, our results from the bread-and-butter lines of insurance will deteriorate, though I think
they will remain satisfactory. The big unknown is super-cat insurance. Were the terrible hurricane seasons
of 2004-05 aberrations? Or were they our planet’s first warning that the climate of the 21st Century will
differ materially from what we’ve seen in the past? If the answer to the second question is yes, 2006 will
soon be perceived as a misleading period of calm preceding a series of devastating storms. These could
rock the insurance industry. It’s naïve to think of Katrina as anything close to a worst-case event.
Neither Ajit Jain, who manages our super-cat operation, nor I know what lies ahead. We do know
that it would be a huge mistake to bet that evolving atmospheric changes are benign in their implications
for insurers.
Don’t think, however, that we have lost our taste for risk. We remain prepared to lose $6 billion
in a single event, if we have been paid appropriately for assuming that risk. We are not willing, though, to
take on even very small exposures at prices that don’t reflect our evaluation of loss probabilities.
Appropriate prices don’t guarantee profits in any given year, but inappropriate prices most certainly
guarantee eventual losses. Rates have recently fallen because a flood of capital has entered the super-cat
field. We have therefore sharply reduced our wind exposures. Our behavior here parallels that which we
employ in financial markets: Be fearful when others are greedy, and be greedy when others are fearful.
Lloyd’s, Equitas and Retroactive Reinsurance
Last year – we are getting now to Equitas – Berkshire agreed to enter into a huge retroactive
reinsurance contract, a policy that protects an insurer against losses that have already happened, but whose
cost is not yet known. I’ll give you details of the agreement shortly. But let’s first take a journey through
insurance history, following the route that led to our deal.
Our tale begins around 1688, when Edward Lloyd opened a small coffee house in London.
Though no Starbucks, his shop was destined to achieve worldwide fame because of the commercial
activities of its clientele – shipowners, merchants and venturesome British capitalists. As these parties
sipped Edward’s brew, they began to write contracts transferring the risk of a disaster at sea from the
owners of ships and their cargo to the capitalists, who wagered that a given voyage would be completed
without incident. These capitalists eventually became known as “underwriters at Lloyd’s.”
instead a place where many member-insurers transact business, just as they did centuries ago.
Over time, the underwriters solicited passive investors to join in syndicates. Additionally, the
business broadened beyond marine risks into every imaginable form of insurance, including exotic
coverages that spread the fame of Lloyd’s far and wide. The underwriters left the coffee house, found
grander quarters and formalized some rules of association. And those persons who passively backed the
underwriters became known as “names.”
Though many people believe Lloyd’s to be an insurance company, that is not the case. It is
8
�
Eventually, the names came to include many thousands of people from around the world, who
joined expecting to pick up some extra change without effort or serious risk. True, prospective names were
always solemnly told that they would have unlimited and everlasting liability for the consequences of their
syndicate’s underwriting – “down to the last cufflink,” as the quaint description went. But that warning
came to be viewed as perfunctory. Three hundred years of retained cufflinks acted as a powerful sedative
to the names poised to sign up.
Then came asbestos. When its prospective costs were added to the tidal wave of environmental
and product claims that surfaced in the 1980s, Lloyd’s began to implode. Policies written decades earlier –
and largely forgotten about – were developing huge losses. No one could intelligently estimate their total,
but it was certain to be many tens of billions of dollars. The specter of unending and unlimited losses
terrified existing names and scared away prospects. Many names opted for bankruptcy; some even chose
suicide.
From these shambles, there came a desperate effort to resuscitate Lloyd’s. In 1996, the powers
that be at the institution allotted £11.1 billion to a new company, Equitas, and made it responsible for
paying all claims on policies written before 1993. In effect, this plan pooled the misery of the many
syndicates in trouble. Of course, the money allotted could prove to be insufficient – and if that happened,
the names remained liable for the shortfall.
But the new plan, by concentrating all of the liabilities in one place, had the advantage of
eliminating much of the costly intramural squabbling that went on among syndicates. Moreover, the
pooling allowed claims evaluation, negotiation and litigation to be handled more intelligently than had been
the case previously. Equitas embraced Ben Franklin’s thinking: “We must all hang together, or assuredly
we shall hang separately.”
From the start, many people predicted Equitas would eventually fail. But as Ajit and I reviewed
the facts in the spring of 2006 – 13 years after the last exposed policy had been written and after the
payment of £11.3 billion in claims – we concluded that the patient was likely to survive. And so we
decided to offer a huge reinsurance policy to Equitas.
Because plenty of imponderables continue to exist, Berkshire could not provide Equitas, and its
27,972 names, unlimited protection. But we said – and I’m simplifying – that if Equitas would give us
$7.12 billion in cash and securities (this is the float I spoke about), we would pay all of its future claims and
expenses up to $13.9 billion. That amount was $5.7 billion above what Equitas had recently guessed its
ultimate liabilities to be. Thus the names received a huge – and almost certainly sufficient – amount of
future protection against unpleasant surprises. Indeed the protection is so large that Equitas plans a cash
payment to its thousands of names, an event few of them had ever dreamed possible.
And how will Berkshire fare? That depends on how much “known” claims will end up costing us,
how many yet-to-be-presented claims will surface and what they will cost, how soon claim payments will
be made and how much we earn on the cash we receive before it must be paid out. Ajit and I think the odds
are in our favor. And should we be wrong, Berkshire can handle it.
easy at night, and we think we’ve just bought them the world’s best mattress.”
Scott Moser, the CEO of Equitas, summarized the transaction neatly: “Names wanted to sleep
* * * * * * * * * * *
Warning: It’s time to eat your broccoli – I am now going to talk about accounting matters. I owe
this to those Berkshire shareholders who love reading about debits and credits. I hope both of you find this
discussion helpful. All others can skip this section; there will be no quiz.
Berkshire has done many retroactive transactions – in both number and amount a multiple of such
policies entered into by any other insurer. We are the reinsurer of choice for these coverages because the
obligations that are transferred to us – for example, lifetime indemnity and medical payments to be made to
injured workers – may not be fully satisfied for 50 years or more. No other company can offer the certainty
9
�


 2025年软考高级信息系统项目管理师金色考点
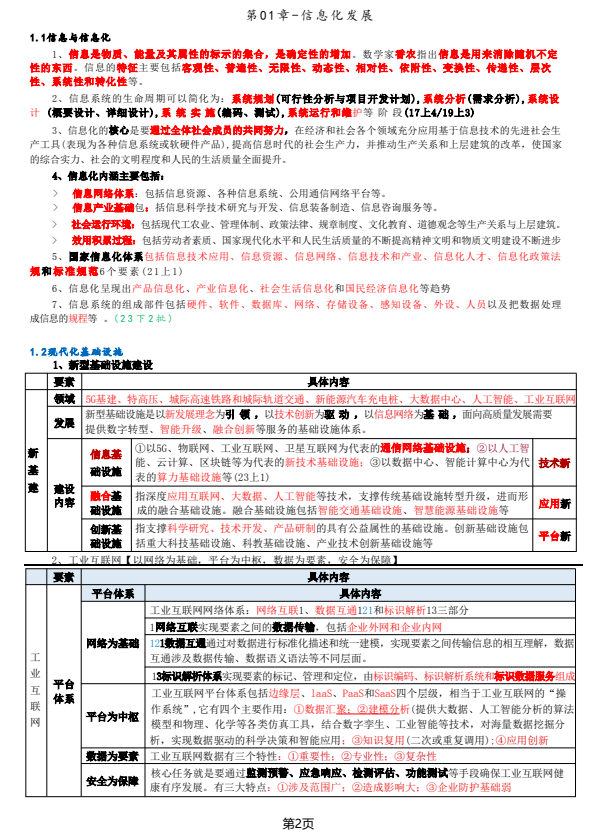 软考高项三色笔记
 镇安县双鑫矿业月河年处理15万吨尾渣综合加工利用项目水土保持报告表
 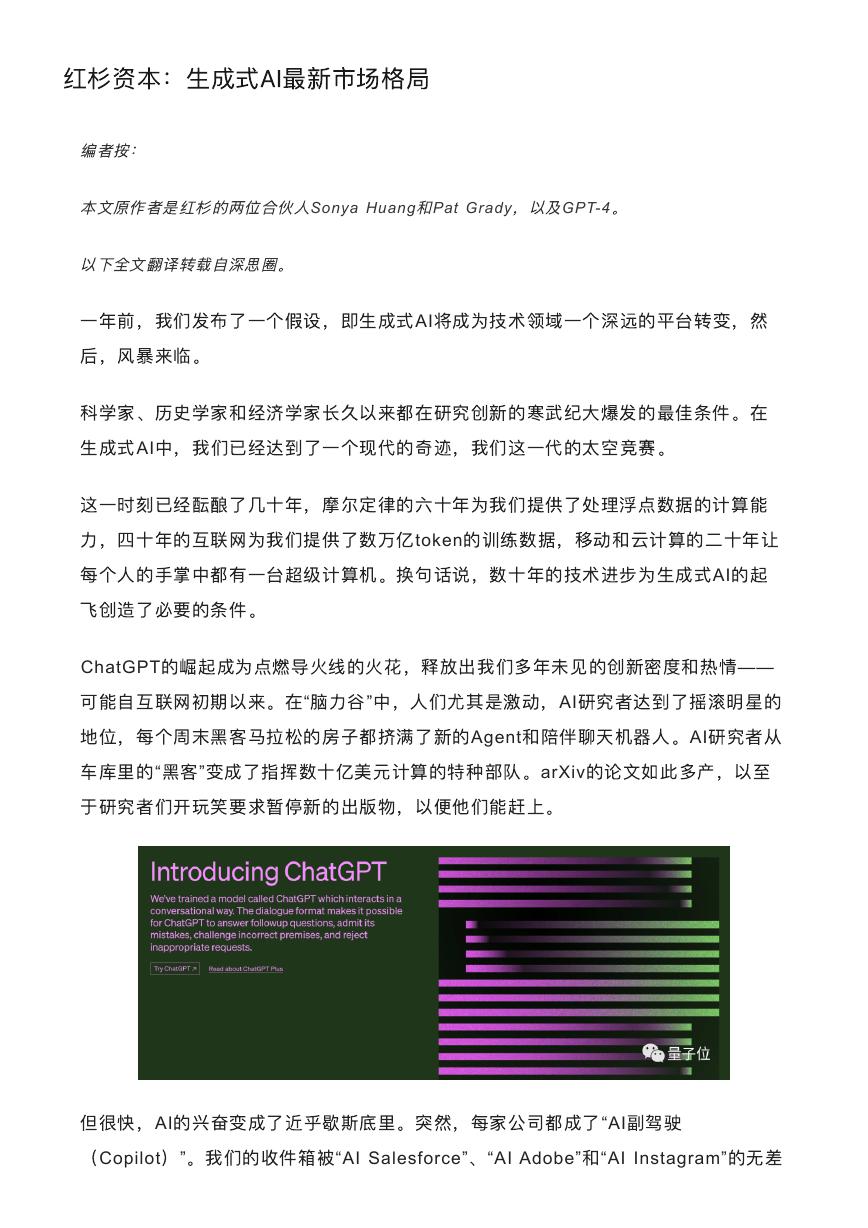 红杉资本:生成式AI最新市场格局.pdf
 wireshark 使用教程.pdf
 【2021年-贝佐斯致股东的信】.pdf
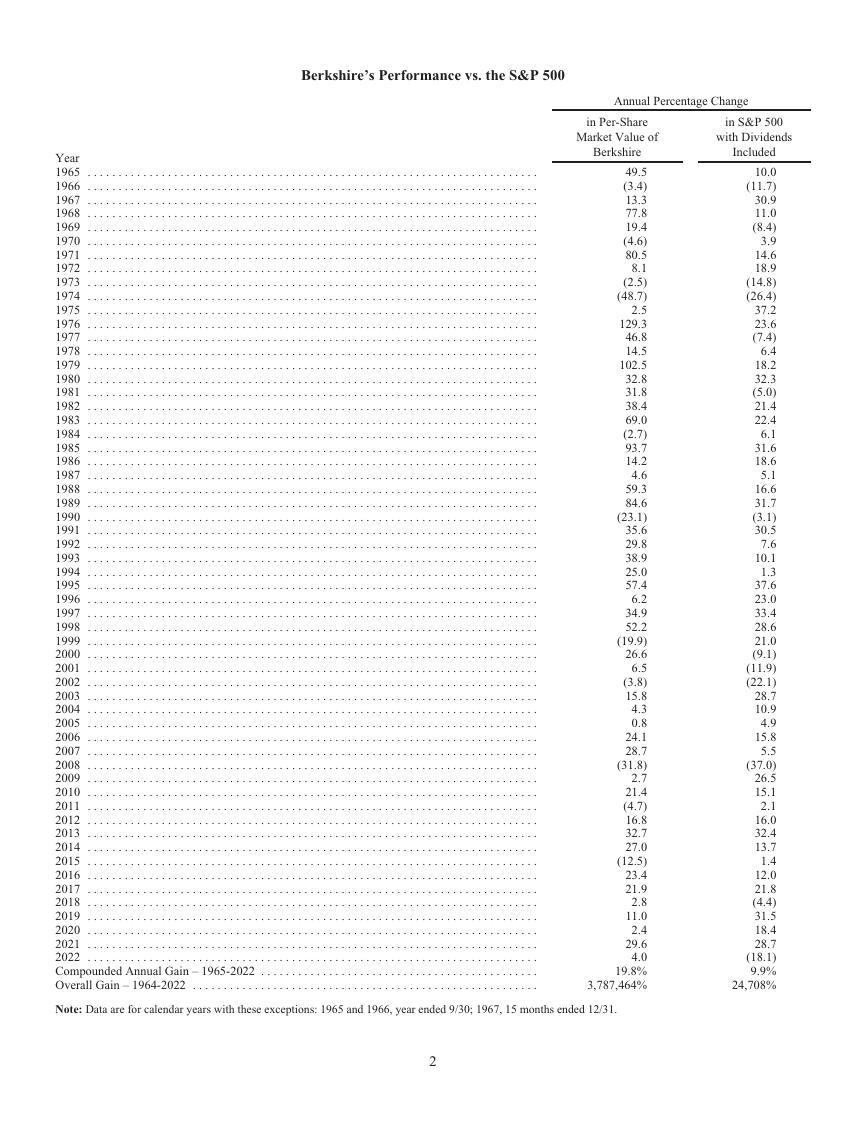 巴菲特致股东的公开信 - 2022.pdf
 MySQL 8.1 参考手册.pdf
 世界银行报告下载:激进政策缩紧浪潮不足遏制通胀 全球经济衰退迫在眉睫(Is a Global Recession Imminent?).pdf
 红杉资本报告:适应与忍耐(Adapting to Endure).pdf
 高保真音响系统设计制作-毕业论文.doc
 一种自适应互补滤波姿态估计算法.pdf