Berkshire’s Corporate Performance vs. the S&P 500
Annual Percentage Change
Year
1965 . . . . . . . . . . . . . . . . . . . . . . . . . . . . . . . . . . . . . . . . . . . . . . . . . . .
1966 . . . . . . . . . . . . . . . . . . . . . . . . . . . . . . . . . . . . . . . . . . . . . . . . . . .
1967 . . . . . . . . . . . . . . . . . . . . . . . . . . . . . . . . . . . . . . . . . . . . . . . . . . .
1968 . . . . . . . . . . . . . . . . . . . . . . . . . . . . . . . . . . . . . . . . . . . . . . . . . . .
1969 . . . . . . . . . . . . . . . . . . . . . . . . . . . . . . . . . . . . . . . . . . . . . . . . . . .
1970 . . . . . . . . . . . . . . . . . . . . . . . . . . . . . . . . . . . . . . . . . . . . . . . . . . .
1971 . . . . . . . . . . . . . . . . . . . . . . . . . . . . . . . . . . . . . . . . . . . . . . . . . . .
1972 . . . . . . . . . . . . . . . . . . . . . . . . . . . . . . . . . . . . . . . . . . . . . . . . . . .
1973 . . . . . . . . . . . . . . . . . . . . . . . . . . . . . . . . . . . . . . . . . . . . . . . . . . .
1974 . . . . . . . . . . . . . . . . . . . . . . . . . . . . . . . . . . . . . . . . . . . . . . . . . . .
1975 . . . . . . . . . . . . . . . . . . . . . . . . . . . . . . . . . . . . . . . . . . . . . . . . . . .
1976 . . . . . . . . . . . . . . . . . . . . . . . . . . . . . . . . . . . . . . . . . . . . . . . . . . .
1977 . . . . . . . . . . . . . . . . . . . . . . . . . . . . . . . . . . . . . . . . . . . . . . . . . . .
1978 . . . . . . . . . . . . . . . . . . . . . . . . . . . . . . . . . . . . . . . . . . . . . . . . . . .
1979 . . . . . . . . . . . . . . . . . . . . . . . . . . . . . . . . . . . . . . . . . . . . . . . . . . .
1980 . . . . . . . . . . . . . . . . . . . . . . . . . . . . . . . . . . . . . . . . . . . . . . . . . . .
1981 . . . . . . . . . . . . . . . . . . . . . . . . . . . . . . . . . . . . . . . . . . . . . . . . . . .
1982 . . . . . . . . . . . . . . . . . . . . . . . . . . . . . . . . . . . . . . . . . . . . . . . . . . .
1983 . . . . . . . . . . . . . . . . . . . . . . . . . . . . . . . . . . . . . . . . . . . . . . . . . . .
1984 . . . . . . . . . . . . . . . . . . . . . . . . . . . . . . . . . . . . . . . . . . . . . . . . . . .
1985 . . . . . . . . . . . . . . . . . . . . . . . . . . . . . . . . . . . . . . . . . . . . . . . . . . .
1986 . . . . . . . . . . . . . . . . . . . . . . . . . . . . . . . . . . . . . . . . . . . . . . . . . . .
1987 . . . . . . . . . . . . . . . . . . . . . . . . . . . . . . . . . . . . . . . . . . . . . . . . . . .
1988 . . . . . . . . . . . . . . . . . . . . . . . . . . . . . . . . . . . . . . . . . . . . . . . . . . .
1989 . . . . . . . . . . . . . . . . . . . . . . . . . . . . . . . . . . . . . . . . . . . . . . . . . . .
1990 . . . . . . . . . . . . . . . . . . . . . . . . . . . . . . . . . . . . . . . . . . . . . . . . . . .
1991 . . . . . . . . . . . . . . . . . . . . . . . . . . . . . . . . . . . . . . . . . . . . . . . . . . .
1992 . . . . . . . . . . . . . . . . . . . . . . . . . . . . . . . . . . . . . . . . . . . . . . . . . . .
1993 . . . . . . . . . . . . . . . . . . . . . . . . . . . . . . . . . . . . . . . . . . . . . . . . . . .
1994 . . . . . . . . . . . . . . . . . . . . . . . . . . . . . . . . . . . . . . . . . . . . . . . . . . .
1995 . . . . . . . . . . . . . . . . . . . . . . . . . . . . . . . . . . . . . . . . . . . . . . . . . . .
1996 . . . . . . . . . . . . . . . . . . . . . . . . . . . . . . . . . . . . . . . . . . . . . . . . . . .
1997 . . . . . . . . . . . . . . . . . . . . . . . . . . . . . . . . . . . . . . . . . . . . . . . . . . .
1998 . . . . . . . . . . . . . . . . . . . . . . . . . . . . . . . . . . . . . . . . . . . . . . . . . . .
1999 . . . . . . . . . . . . . . . . . . . . . . . . . . . . . . . . . . . . . . . . . . . . . . . . . . .
2000 . . . . . . . . . . . . . . . . . . . . . . . . . . . . . . . . . . . . . . . . . . . . . . . . . . .
2001 . . . . . . . . . . . . . . . . . . . . . . . . . . . . . . . . . . . . . . . . . . . . . . . . . . .
2002 . . . . . . . . . . . . . . . . . . . . . . . . . . . . . . . . . . . . . . . . . . . . . . . . . . .
2003 . . . . . . . . . . . . . . . . . . . . . . . . . . . . . . . . . . . . . . . . . . . . . . . . . . .
2004 . . . . . . . . . . . . . . . . . . . . . . . . . . . . . . . . . . . . . . . . . . . . . . . . . . .
2005 . . . . . . . . . . . . . . . . . . . . . . . . . . . . . . . . . . . . . . . . . . . . . . . . . . .
2006 . . . . . . . . . . . . . . . . . . . . . . . . . . . . . . . . . . . . . . . . . . . . . . . . . . .
2007 . . . . . . . . . . . . . . . . . . . . . . . . . . . . . . . . . . . . . . . . . . . . . . . . . . .
2008 . . . . . . . . . . . . . . . . . . . . . . . . . . . . . . . . . . . . . . . . . . . . . . . . . . .
2009 . . . . . . . . . . . . . . . . . . . . . . . . . . . . . . . . . . . . . . . . . . . . . . . . . . .
in Per-Share
Book Value of
Berkshire
(1)
23.8
20.3
11.0
19.0
16.2
12.0
16.4
21.7
4.7
5.5
21.9
59.3
31.9
24.0
35.7
19.3
31.4
40.0
32.3
13.6
48.2
26.1
19.5
20.1
44.4
7.4
39.6
20.3
14.3
13.9
43.1
31.8
34.1
48.3
.5
6.5
(6.2)
10.0
21.0
10.5
6.4
18.4
11.0
(9.6)
19.8
in S&P 500
with Dividends
Included
(2)
10.0
(11.7)
30.9
11.0
(8.4)
3.9
14.6
18.9
(14.8)
(26.4)
37.2
23.6
(7.4)
6.4
18.2
32.3
(5.0)
21.4
22.4
6.1
31.6
18.6
5.1
16.6
31.7
(3.1)
30.5
7.6
10.1
1.3
37.6
23.0
33.4
28.6
21.0
(9.1)
(11.9)
(22.1)
28.7
10.9
4.9
15.8
5.5
(37.0)
26.5
Relative
Results
(1)-(2)
13.8
32.0
(19.9)
8.0
24.6
8.1
1.8
2.8
19.5
31.9
(15.3)
35.7
39.3
17.6
17.5
(13.0)
36.4
18.6
9.9
7.5
16.6
7.5
14.4
3.5
12.7
10.5
9.1
12.7
4.2
12.6
5.5
8.8
.7
19.7
(20.5)
15.6
5.7
32.1
(7.7)
(.4)
1.5
2.6
5.5
27.4
(6.7)
Compounded Annual Gain – 1965-2009 . . . . . . . . . . . . . . . . . . . . . . .
Overall Gain – 1964-2009 . . . . . . . . . . . . . . . . . . . . . . . . . . . . . . . . . .
Notes: Data are for calendar years with these exceptions: 1965 and 1966, year ended 9/30; 1967, 15 months ended
12/31.
20.3%
434,057%
9.3%
5,430%
11.0
Starting in 1979, accounting rules required insurance companies to value the equity securities they hold at market
rather than at the lower of cost or market, which was previously the requirement. In this table, Berkshire’s results
through 1978 have been restated to conform to the changed rules. In all other respects, the results are calculated using
the numbers originally reported.
The S&P 500 numbers are pre-tax whereas the Berkshire numbers are after-tax. If a corporation such as Berkshire
were simply to have owned the S&P 500 and accrued the appropriate taxes, its results would have lagged the S&P 500
in years when that index showed a positive return, but would have exceeded the S&P 500 in years when the index
showed a negative return. Over the years, the tax costs would have caused the aggregate lag to be substantial.
2
�
BERKSHIRE HATHAWAY INC.
To the Shareholders of Berkshire Hathaway Inc.:
Our gain in net worth during 2009 was $21.8 billion, which increased the per-share book value of both
our Class A and Class B stock by 19.8%. Over the last 45 years (that is, since present management took over)
book value has grown from $19 to $84,487, a rate of 20.3% compounded annually.*
Berkshire’s recent acquisition of Burlington Northern Santa Fe (BNSF) has added at least 65,000
shareholders to the 500,000 or so already on our books. It’s important to Charlie Munger, my long-time partner,
and me that all of our owners understand Berkshire’s operations, goals, limitations and culture. In each annual
report, consequently, we restate the economic principles that guide us. This year these principles appear on pages
89-94 and I urge all of you – but particularly our new shareholders – to read them. Berkshire has adhered to these
principles for decades and will continue to do so long after I’m gone.
In this letter we will also review some of the basics of our business, hoping to provide both a freshman
orientation session for our BNSF newcomers and a refresher course for Berkshire veterans.
How We Measure Ourselves
Our metrics for evaluating our managerial performance are displayed on the facing page. From the start,
Charlie and I have believed in having a rational and unbending standard for measuring what we have – or have
not – accomplished. That keeps us from the temptation of seeing where the arrow of performance lands and then
painting the bull’s eye around it.
Selecting the S&P 500 as our bogey was an easy choice because our shareholders, at virtually no cost, can
match its performance by holding an index fund. Why should they pay us for merely duplicating that result?
A more difficult decision for us was how to measure the progress of Berkshire versus the S&P. There are
good arguments for simply using the change in our stock price. Over an extended period of time, in fact, that is
the best test. But year-to-year market prices can be extraordinarily erratic. Even evaluations covering as long as a
decade can be greatly distorted by foolishly high or low prices at the beginning or end of the measurement
period. Steve Ballmer, of Microsoft, and Jeff Immelt, of GE, can tell you about that problem, suffering as they do
from the nosebleed prices at which their stocks traded when they were handed the managerial baton.
The ideal standard for measuring our yearly progress would be the change in Berkshire’s per-share intrinsic
value. Alas, that value cannot be calculated with anything close to precision, so we instead use a crude proxy for
it: per-share book value. Relying on this yardstick has its shortcomings, which we discuss on pages 92 and 93.
Additionally, book value at most companies understates intrinsic value, and that is certainly the case at
Berkshire. In aggregate, our businesses are worth considerably more than the values at which they are carried on
our books. In our all-important insurance business, moreover, the difference is huge. Even so, Charlie and I
believe that our book value – understated though it is – supplies the most useful tracking device for changes in
intrinsic value. By this measurement, as the opening paragraph of this letter states, our book value since the start
of fiscal 1965 has grown at a rate of 20.3% compounded annually.
*All per-share figures used in this report apply to Berkshire’s A shares. Figures for the B shares are
1/1500th of those shown for A.
3
�
We should note that had we instead chosen market prices as our yardstick, Berkshire’s results would
look better, showing a gain since the start of fiscal 1965 of 22% compounded annually. Surprisingly, this modest
difference in annual compounding rate leads to an 801,516% market-value gain for the entire 45-year period
compared to the book-value gain of 434,057% (shown on page 2). Our market gain is better because in 1965
Berkshire shares sold at an appropriate discount to the book value of its underearning textile assets, whereas
today Berkshire shares regularly sell at a premium to the accounting values of its first-class businesses.
Summed up, the table on page 2 conveys three messages, two positive and one hugely negative. First,
we have never had any five-year period beginning with 1965-69 and ending with 2005-09 – and there have been
41 of these – during which our gain in book value did not exceed the S&P’s gain. Second, though we have lagged
the S&P in some years that were positive for the market, we have consistently done better than the S&P in the
eleven years during which it delivered negative results. In other words, our defense has been better than our
offense, and that’s likely to continue.
The big minus is that our performance advantage has shrunk dramatically as our size has grown, an
unpleasant trend that is certain to continue. To be sure, Berkshire has many outstanding businesses and a cadre of
truly great managers, operating within an unusual corporate culture that lets them maximize their talents. Charlie
and I believe these factors will continue to produce better-than-average results over time. But huge sums forge
their own anchor and our future advantage, if any, will be a small fraction of our historical edge.
What We Don’t Do
Long ago, Charlie laid out his strongest ambition: “All I want to know is where I’m going to die, so I’ll
never go there.” That bit of wisdom was inspired by Jacobi, the great Prussian mathematician, who counseled
“Invert, always invert” as an aid to solving difficult problems. (I can report as well that this inversion approach
works on a less lofty level: Sing a country song in reverse, and you will quickly recover your car, house and
wife.)
Here are a few examples of how we apply Charlie’s thinking at Berkshire:
• Charlie and I avoid businesses whose futures we can’t evaluate, no matter how exciting their
products may be. In the past, it required no brilliance for people to foresee the fabulous growth
that awaited such industries as autos (in 1910), aircraft (in 1930) and television sets (in 1950). But
the future then also included competitive dynamics that would decimate almost all of the
companies entering those industries. Even the survivors tended to come away bleeding.
Just because Charlie and I can clearly see dramatic growth ahead for an industry does not mean
we can judge what its profit margins and returns on capital will be as a host of competitors battle
for supremacy. At Berkshire we will stick with businesses whose profit picture for decades to
come seems reasonably predictable. Even then, we will make plenty of mistakes.
• We will never become dependent on the kindness of strangers. Too-big-to-fail is not a fallback
position at Berkshire. Instead, we will always arrange our affairs so that any requirements for cash
we may conceivably have will be dwarfed by our own liquidity. Moreover, that liquidity will be
constantly refreshed by a gusher of earnings from our many and diverse businesses.
When the financial system went into cardiac arrest in September 2008, Berkshire was a supplier
of liquidity and capital to the system, not a supplicant. At the very peak of the crisis, we poured
$15.5 billion into a business world that could otherwise look only to the federal government for
help. Of that, $9 billion went to bolster capital at three highly-regarded and previously-secure
American businesses that needed – without delay – our tangible vote of confidence. The remaining
$6.5 billion satisfied our commitment to help fund the purchase of Wrigley, a deal that was
completed without pause while, elsewhere, panic reigned.
4
�
We pay a steep price to maintain our premier financial strength. The $20 billion-plus of cash-
equivalent assets that we customarily hold is earning a pittance at present. But we sleep well.
• We tend to let our many subsidiaries operate on their own, without our supervising and
monitoring them to any degree. That means we are sometimes late in spotting management
problems and that both operating and capital decisions are occasionally made with which Charlie
and I would have disagreed had we been consulted. Most of our managers, however, use the
independence we grant them magnificently, rewarding our confidence by maintaining an owner-
oriented attitude that is invaluable and too seldom found in huge organizations. We would rather
suffer the visible costs of a few bad decisions than incur the many invisible costs that come from
decisions made too slowly – or not at all – because of a stifling bureaucracy.
With our acquisition of BNSF, we now have about 257,000 employees and literally hundreds of
different operating units. We hope to have many more of each. But we will never allow Berkshire
to become some monolith that is overrun with committees, budget presentations and multiple
layers of management. Instead, we plan to operate as a collection of separately-managed medium-
sized and large businesses, most of whose decision-making occurs at the operating level. Charlie
and I will limit ourselves to allocating capital, controlling enterprise risk, choosing managers and
setting their compensation.
• We make no attempt to woo Wall Street. Investors who buy and sell based upon media or analyst
commentary are not for us. Instead we want partners who join us at Berkshire because they wish
to make a long-term investment in a business they themselves understand and because it’s one that
follows policies with which they concur. If Charlie and I were to go into a small venture with a
few partners, we would seek individuals in sync with us, knowing that common goals and a shared
destiny make for a happy business “marriage” between owners and managers. Scaling up to giant
size doesn’t change that truth.
To build a compatible shareholder population, we try to communicate with our owners directly
and informatively. Our goal is to tell you what we would like to know if our positions were
reversed. Additionally, we try to post our quarterly and annual financial information on the
Internet early on weekends, thereby giving you and other investors plenty of time during a
non-trading period to digest just what has happened at our multi-faceted enterprise. (Occasionally,
SEC deadlines force a non-Friday disclosure.) These matters simply can’t be adequately
summarized in a few paragraphs, nor do they lend themselves to the kind of catchy headline that
journalists sometimes seek.
Last year we saw, in one instance, how sound-bite reporting can go wrong. Among the 12,830
words in the annual letter was this sentence: “We are certain, for example, that the economy will
be in shambles throughout 2009 – and probably well beyond – but that conclusion does not tell us
whether the market will rise or fall.” Many news organizations reported – indeed, blared – the first
part of the sentence while making no mention whatsoever of its ending. I regard this as terrible
journalism: Misinformed readers or viewers may well have thought that Charlie and I were
forecasting bad things for the stock market, though we had not only in that sentence, but also
elsewhere, made it clear we weren’t predicting the market at all. Any investors who were misled
by the sensationalists paid a big price: The Dow closed the day of the letter at 7,063 and finished
the year at 10,428.
Given a few experiences we’ve had like that, you can understand why I prefer that our
communications with you remain as direct and unabridged as possible.
* * * * * * * * * * * *
Let’s move to the specifics of Berkshire’s operations. We have four major operating sectors, each
differing from the others in balance sheet and income account characteristics. Therefore, lumping them together,
as is standard in financial statements, impedes analysis. So we’ll present them as four separate businesses, which
is how Charlie and I view them.
5
�
Insurance
Our property-casualty (P/C) insurance business has been the engine behind Berkshire’s growth and will
continue to be. It has worked wonders for us. We carry our P/C companies on our books at $15.5 billion more
than their net tangible assets, an amount lodged in our “Goodwill” account. These companies, however, are
worth far more than their carrying value – and the following look at the economic model of the P/C industry will
tell you why.
Insurers receive premiums upfront and pay claims later. In extreme cases, such as those arising from
certain workers’ compensation accidents, payments can stretch over decades. This collect-now, pay-later model
leaves us holding large sums – money we call “float” – that will eventually go to others. Meanwhile, we get to
invest this float for Berkshire’s benefit. Though individual policies and claims come and go, the amount of float
we hold remains remarkably stable in relation to premium volume. Consequently, as our business grows, so does
our float.
If premiums exceed the total of expenses and eventual losses, we register an underwriting profit that
adds to the investment income produced from the float. This combination allows us to enjoy the use of free
money – and, better yet, get paid for holding it. Alas, the hope of this happy result attracts intense competition,
so vigorous in most years as to cause the P/C industry as a whole to operate at a significant underwriting loss.
This loss, in effect, is what the industry pays to hold its float. Usually this cost is fairly low, but in some
catastrophe-ridden years the cost from underwriting losses more than eats up the income derived from use of
float.
In my perhaps biased view, Berkshire has the best large insurance operation in the world. And I will
absolutely state that we have the best managers. Our float has grown from $16 million in 1967, when we entered
the business, to $62 billion at the end of 2009. Moreover, we have now operated at an underwriting profit for
seven consecutive years. I believe it likely that we will continue to underwrite profitably in most – though
certainly not all – future years. If we do so, our float will be cost-free, much as if someone deposited $62 billion
with us that we could invest for our own benefit without the payment of interest.
Let me emphasize again that cost-free float is not a result to be expected for the P/C industry as a
whole: In most years, premiums have been inadequate to cover claims plus expenses. Consequently, the
industry’s overall return on tangible equity has for many decades fallen far short of that achieved by the S&P
500. Outstanding economics exist at Berkshire only because we have some outstanding managers running some
unusual businesses. Our insurance CEOs deserve your thanks, having added many billions of dollars to
Berkshire’s value. It’s a pleasure for me to tell you about these all-stars.
* * * * * * * * * * * *
Let’s start at GEICO, which is known to all of you because of its $800 million annual advertising
budget (close to twice that of the runner-up advertiser in the auto insurance field). GEICO is managed by Tony
Nicely, who joined the company at 18. Now 66, Tony still tap-dances to the office every day, just as I do at 79.
We both feel lucky to work at a business we love.
GEICO’s customers have warm feelings toward the company as well. Here’s proof: Since Berkshire
acquired control of GEICO in 1996, its market share has increased from 2.5% to 8.1%, a gain reflecting the net
addition of seven million policyholders. Perhaps they contacted us because they thought our gecko was cute, but
they bought from us to save important money. (Maybe you can as well; call 1-800-847-7536 or go to
www.GEICO.com.) And they’ve stayed with us because they like our service as well as our price.
Berkshire acquired GEICO in two stages. In 1976-80 we bought about one-third of the company’s
stock for $47 million. Over the years, large repurchases by the company of its own shares caused our position to
grow to about 50% without our having bought any more shares. Then, on January 2, 1996, we acquired the
remaining 50% of GEICO for $2.3 billion in cash, about 50 times the cost of our original purchase.
6
�
An old Wall Street joke gets close to our experience:
Customer:
Thanks for putting me in XYZ stock at 5. I hear it’s up to 18.
Broker:
Yes, and that’s just the beginning. In fact, the company is doing so well now,
that it’s an even better buy at 18 than it was when you made your purchase.
Customer:
Damn, I knew I should have waited.
GEICO’s growth may slow in 2010. U.S. vehicle registrations are actually down because of slumping
auto sales. Moreover, high unemployment is causing a growing number of drivers to go uninsured. (That’s illegal
almost everywhere, but if you’ve lost your job and still want to drive . . .) Our “low-cost producer” status,
however, is sure to give us significant gains in the future. In 1995, GEICO was the country’s sixth largest auto
insurer; now we are number three. The company’s float has grown from $2.7 billion to $9.6 billion. Equally
important, GEICO has operated at an underwriting profit in 13 of the 14 years Berkshire has owned it.
I became excited about GEICO in January 1951, when I first visited the company as a 20-year-old
student. Thanks to Tony, I’m even more excited today.
A hugely important event in Berkshire’s history occurred on a Saturday in 1985. Ajit Jain came into
our office in Omaha – and I immediately knew we had found a superstar. (He had been discovered by Mike
Goldberg, now elevated to St. Mike.)
* * * * * * * * * * * *
We immediately put Ajit in charge of National Indemnity’s small and struggling reinsurance operation.
Over the years, he has built this business into a one-of-a-kind giant in the insurance world.
Staffed today by only 30 people, Ajit’s operation has set records for transaction size in several areas of
insurance. Ajit writes billion-dollar limits – and then keeps every dime of the risk instead of laying it off with
other insurers. Three years ago, he took over huge liabilities from Lloyds, allowing it to clean up its relationship
with 27,972 participants (“names”) who had written problem-ridden policies that at one point threatened the
survival of this 322-year-old institution. The premium for that single contract was $7.1 billion. During 2009, he
negotiated a life reinsurance contract that could produce $50 billion of premium for us over the next 50 or so
years.
Ajit’s business is just the opposite of GEICO’s. At that company, we have millions of small policies
that largely renew year after year. Ajit writes relatively few policies, and the mix changes significantly from year
to year. Throughout the world, he is known as the man to call when something both very large and unusual needs
to be insured.
If Charlie, I and Ajit are ever in a sinking boat – and you can only save one of us – swim to Ajit.
Our third insurance powerhouse is General Re. Some years back this operation was troubled; now it is
a gleaming jewel in our insurance crown.
* * * * * * * * * * * *
Under the leadership of Tad Montross, General Re had an outstanding underwriting year in 2009, while
also delivering us unusually large amounts of float per dollar of premium volume. Alongside General Re’s P/C
business, Tad and his associates have developed a major life reinsurance operation that has grown increasingly
valuable.
Last year General Re finally attained 100% ownership of Cologne Re, which since 1995 has been a
key – though only partially-owned – part of our presence around the world. Tad and I will be visiting Cologne in
September to thank its managers for their important contribution to Berkshire.
7
�
Finally, we own a group of smaller companies, most of them specializing in odd corners of the
insurance world. In aggregate, their results have consistently been profitable and, as the table below shows, the
float they provide us is substantial. Charlie and I treasure these companies and their managers.
Here is the record of all four segments of our property-casualty and life insurance businesses:
Underwriting Profit
Yearend Float
(in millions)
Insurance Operations
General Re . . . . . . . . . . . . . . . . . . . . . .
BH Reinsurance . . . . . . . . . . . . . . . . . .
GEICO . . . . . . . . . . . . . . . . . . . . . . . . .
Other Primary . . . . . . . . . . . . . . . . . . .
2009
$ 477
349
649
84
$1,559
2008
$ 342
1,324
916
210
$2,792
2009
$21,014
26,223
9,613
5,061
$61,911
2008
$21,074
24,221
8,454
4,739
$58,488
And now a painful confession: Last year your chairman closed the book on a very expensive business
fiasco entirely of his own making.
* * * * * * * * * * * *
For many years I had struggled to think of side products that we could offer our millions of loyal
GEICO customers. Unfortunately, I finally succeeded, coming up with a brilliant insight that we should market
our own credit card. I reasoned that GEICO policyholders were likely to be good credit risks and, assuming we
offered an attractive card, would likely favor us with their business. We got business all right – but of the wrong
type.
Our pre-tax losses from credit-card operations came to about $6.3 million before I finally woke up. We
then sold our $98 million portfolio of troubled receivables for 55¢ on the dollar, losing an additional $44 million.
GEICO’s managers, it should be emphasized, were never enthusiastic about my idea. They warned me
that instead of getting the cream of GEICO’s customers we would get the – – – – – well, let’s call it the
non-cream. I subtly indicated that I was older and wiser.
I was just older.
Regulated Utility Business
Berkshire has an 89.5% interest in MidAmerican Energy Holdings, which owns a wide variety of
utility operations. The largest of these are (1) Yorkshire Electricity and Northern Electric, whose 3.8 million end
users make it the U.K.’s third largest distributor of electricity; (2) MidAmerican Energy, which serves 725,000
electric customers, primarily in Iowa; (3) Pacific Power and Rocky Mountain Power, serving about 1.7 million
electric customers in six western states; and (4) Kern River and Northern Natural pipelines, which carry about
8% of the natural gas consumed in the U.S.
MidAmerican has two terrific managers, Dave Sokol and Greg Abel. In addition, my long-time friend,
Walter Scott, along with his family, has a major ownership position in the company. Walter brings extraordinary
business savvy to any operation. Ten years of working with Dave, Greg and Walter have reinforced my original
belief: Berkshire couldn’t have better partners. They are truly a dream team.
Somewhat incongruously, MidAmerican also owns the second largest real estate brokerage firm in the
U.S., HomeServices of America. This company operates through 21 locally-branded firms that have 16,000
agents. Though last year was again a terrible year for home sales, HomeServices earned a modest sum. It also
acquired a firm in Chicago and will add other quality brokerage operations when they are available at sensible
prices. A decade from now, HomeServices is likely to be much larger.
8
�
Here are some key figures on MidAmerican’s operations:
Earnings (in millions)
2009
2008
U.K. utilities . . . . . . . . . . . . . . . . . . . . . . . . . . . . . . . . . . . . . . . . . . . . . . . . . . . . . . . . . . . .
Iowa utility . . . . . . . . . . . . . . . . . . . . . . . . . . . . . . . . . . . . . . . . . . . . . . . . . . . . . . . . . . . . .
Western utilities . . . . . . . . . . . . . . . . . . . . . . . . . . . . . . . . . . . . . . . . . . . . . . . . . . . . . . . . .
Pipelines . . . . . . . . . . . . . . . . . . . . . . . . . . . . . . . . . . . . . . . . . . . . . . . . . . . . . . . . . . . . . . .
HomeServices . . . . . . . . . . . . . . . . . . . . . . . . . . . . . . . . . . . . . . . . . . . . . . . . . . . . . . . . . . .
Other (net) . . . . . . . . . . . . . . . . . . . . . . . . . . . . . . . . . . . . . . . . . . . . . . . . . . . . . . . . . . . . . .
Operating earnings before corporate interest and taxes . . . . . . . . . . . . . . . . . . . . . . . . . . .
Constellation Energy * . . . . . . . . . . . . . . . . . . . . . . . . . . . . . . . . . . . . . . . . . . . . . . . . . . . .
Interest, other than to Berkshire . . . . . . . . . . . . . . . . . . . . . . . . . . . . . . . . . . . . . . . . . . . . .
Interest on Berkshire junior debt . . . . . . . . . . . . . . . . . . . . . . . . . . . . . . . . . . . . . . . . . . . . .
Income tax . . . . . . . . . . . . . . . . . . . . . . . . . . . . . . . . . . . . . . . . . . . . . . . . . . . . . . . . . . . . . .
Net earnings . . . . . . . . . . . . . . . . . . . . . . . . . . . . . . . . . . . . . . . . . . . . . . . . . . . . . . . . . . . . .
Earnings applicable to Berkshire ** . . . . . . . . . . . . . . . . . . . . . . . . . . . . . . . . . . . . . . . . . .
Debt owed to others . . . . . . . . . . . . . . . . . . . . . . . . . . . . . . . . . . . . . . . . . . . . . . . . . . . . . . .
Debt owed to Berkshire . . . . . . . . . . . . . . . . . . . . . . . . . . . . . . . . . . . . . . . . . . . . . . . . . . . .
$
248
285
788
457
43
25
1,846
—
(318)
(58)
(313)
$ 1,157
$ 1,071
19,579
353
$
339
425
703
595
(45)
186
2,203
1,092
(332)
(111)
(1,002)
$ 1,850
$ 1,704
19,145
1,087
*Consists of a breakup fee of $175 million and a profit on our investment of $917 million.
**Includes interest earned by Berkshire (net of related income taxes) of $38 in 2009 and $72 in 2008.
Our regulated electric utilities, offering monopoly service in most cases, operate in a symbiotic manner
with the customers in their service areas, with those users depending on us to provide first-class service and
invest for their future needs. Permitting and construction periods for generation and major transmission facilities
stretch way out, so it is incumbent on us to be far-sighted. We, in turn, look to our utilities’ regulators (acting on
behalf of our customers) to allow us an appropriate return on the huge amounts of capital we must deploy to meet
future needs. We shouldn’t expect our regulators to live up to their end of the bargain unless we live up to ours.
Dave and Greg make sure we do just that. National research companies consistently rank our Iowa and
Western utilities at or near the top of their industry. Similarly, among the 43 U.S. pipelines ranked by a firm
named Mastio, our Kern River and Northern Natural properties tied for second place.
Moreover, we continue to pour huge sums of money into our operations so as to not only prepare for
the future but also make these operations more environmentally friendly. Since we purchased MidAmerican ten
years ago, it has never paid a dividend. We have instead used earnings to improve and expand our properties in
each of the territories we serve. As one dramatic example, in the last three years our Iowa and Western utilities
have earned $2.5 billion, while in this same period spending $3 billion on wind generation facilities.
MidAmerican has consistently kept its end of the bargain with society and, to society’s credit, it has
reciprocated: With few exceptions, our regulators have promptly allowed us to earn a fair return on the ever-
increasing sums of capital we must invest. Going forward, we will do whatever it takes to serve our territories in
the manner they expect. We believe that, in turn, we will be allowed the return we deserve on the funds we
invest.
In earlier days, Charlie and I shunned capital-intensive businesses such as public utilities. Indeed, the
best businesses by far for owners continue to be those that have high returns on capital and that require little
incremental investment to grow. We are fortunate to own a number of such businesses, and we would love to buy
more. Anticipating, however, that Berkshire will generate ever-increasing amounts of cash, we are today quite
willing to enter businesses that regularly require large capital expenditures. We expect only that these businesses
have reasonable expectations of earning decent returns on the incremental sums they invest. If our expectations
are met – and we believe that they will be – Berkshire’s ever-growing collection of good to great businesses
should produce above-average, though certainly not spectacular, returns in the decades ahead.
9
�


 2025年软考高级信息系统项目管理师金色考点
 软考高项三色笔记
 镇安县双鑫矿业月河年处理15万吨尾渣综合加工利用项目水土保持报告表
  红杉资本:生成式AI最新市场格局.pdf
 wireshark 使用教程.pdf
 【2021年-贝佐斯致股东的信】.pdf
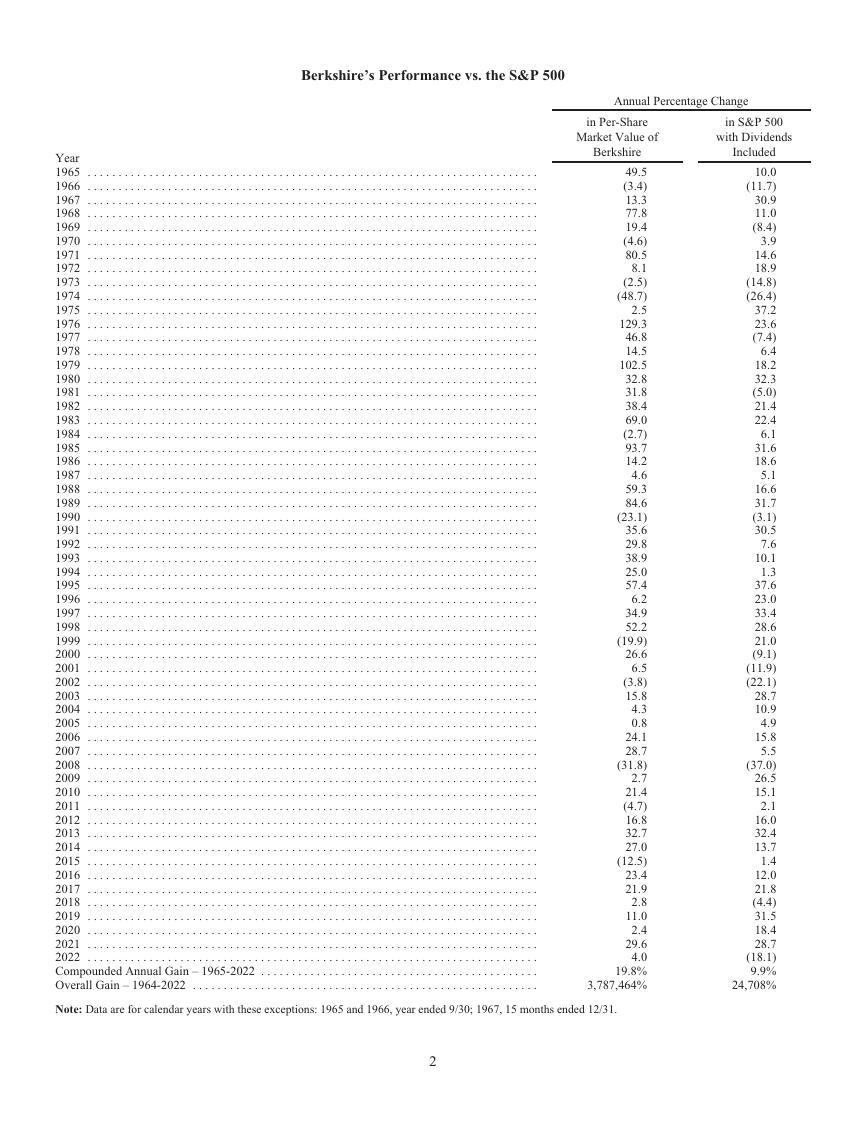 巴菲特致股东的公开信 - 2022.pdf
 MySQL 8.1 参考手册.pdf
 世界银行报告下载:激进政策缩紧浪潮不足遏制通胀 全球经济衰退迫在眉睫(Is a Global Recession Imminent?).pdf
 红杉资本报告:适应与忍耐(Adapting to Endure).pdf
 高保真音响系统设计制作-毕业论文.doc
 一种自适应互补滤波姿态估计算法.pdf